Everyday, Everyday I Have the Blues
By John Stoltzfus,
Chief Investment Strategist
This Bull's Got Legs
The most recent rally is just the latest chapter for a bull market that began in March of 2009
Market action last week appeared to us to turn skeptics into bulls, bears into skeptics and at least some bulls into weekend philosophers.
The Dow, the S&P 500 and the NASDAQ Composite respectively gained 3.06%, 3.08% and 3.6% last week led by the S&P 400 (mid-caps), the S&P 600 (small-caps) which advanced respectively 4.2%, 5.95% in the same period.
Last week’s collective moves—all of which earlier in the year might have been readily accepted as “enough action for a year”—jarred at least some market participants’ memories of the first seven weeks of the year when stocks established what appears now to have been the low for the year on February 11th joined by a nadir in the price of oil as well as a bottoming in a host of other commodities prices.
And then there was the third week of June when the Brexit referendum with its own cabal of worries and dread surfaced.
Most recently in the first few hours of the election night coverage stateside when the stock market got wind that the outcome was likely to be the one few predicted. The market first headed south (with the Dow Jones Industrials’ futures indicating a drop of some 900 points) before sensing that the surprise winning candidate’s agenda might be good for the economy and stocks, turned 180 degrees north into the rally that now has the venerable Dow Industrial average near the threshold of 20,000.
The question we hear from investors who have missed the equity rally thus far is “how long can this go on?”
We believe it’s a good question and one that is best answered in short form starting with another question: “What got stocks to these levels?”
We think there’s no need to rebrand the rally that has taken stocks to where they closed on Friday. Calling the surge in stocks since the November 8th Presidential election “The Trump Rally” may well identify the most recent cause for the latest move up for the bull market that began in March of 2009 but it’s only the latest chapter to the story of what is one of the greatest (though ironically most disdained) bull markets of the past 30-plus years.
There are key factors that we believe warrant investors’ attention to not underestimate how long the next leg of the bull market could run (notwithstanding catalyst-driven pullbacks that are likely to emerge at points along the way) to a goal as of yet envisioned by investors.
We consider a confluence of factors which have brought the markets to where they closed last Friday from the depths of the lows in March of 2009. These include:
All of the above as well as a degree of restraint surrounding the equity markets have helped keep the bull market determinedly climbing the proverbial wall of worry, notwithstanding a few detours along the way. It leads us to believe once again that “this bull’s got legs and knows how to use them.”
We expect the Fed’s FOMC meeting, which runs from Tuesday to Wednesday, will capture much though not all of the market’s attention this week as economic data continues to cross the transom and the progress of choosing cabinet members and other staffing and agency appointments emanates from the offices of the President-elect and his staff.
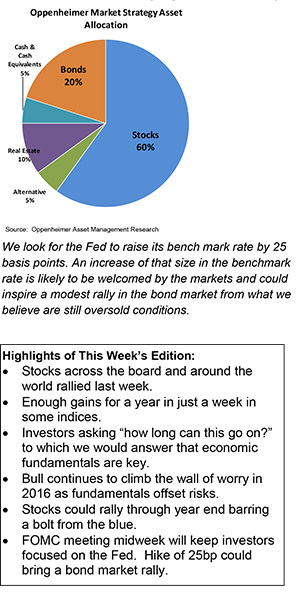
We look for the Fed to raise its benchmark rate by 25 basis points. An increase of that size in the benchmark rate is likely to be welcomed by the markets and could inspire a modest rally in the 3 bond market from what we believe are still oversold conditions.
The dollar, which has persistently maintained and even added strength since the election, could ease lower. The dollar historically has been known to strengthen ahead of Fed tightening and then move lower after the Fed takes action.
We continue to favor cyclical sectors over defensives and remain market cap agnostic (opting for broad exposure over large, mid and small cap stocks) in an environment where risk in much of fixed income appears greater than that which appears in the equity market near term as the process of interest rate normalization moves ahead and the economy grows at a sustainable but moderate pace.
For the complete report, please contact your Oppenheimer Financial Advisor.
Other Disclosures
This report is issued and approved by Oppenheimer & Co. Inc., a member of all Principal Exchanges, and SIPC. This report is distributed by Oppenheimer & Co. Inc., for informational purposes only, to its institutional and retail investor clients. This report does not constitute an offer or solicitation to buy or sell any securities discussed herein in any jurisdiction where such offer or solicitation would be prohibited. The securities mentioned in this report may not be suitable for all types of investors. This report does not take into account the investment objectives, financial situation or specific needs of any particular client of Oppenheimer & Co. Inc. Recipients should consider this report as only a single factor in making an investment decision and should not rely solely on investment recommendations contained herein, if any, as a substitution for the exercise of independent judgment of the merits and risks of investments. The strategist writing this report is not a person or company with actual, implied or apparent authority to act on behalf of any issuer mentioned in the report. Before making an investment decision with respect to any security discussed in this report, the recipient should consider whether such investment is appropriate given the recipient's particular investment needs, objectives and financial circumstances. We recommend that investors independently evaluate particular investments and strategies, and encourage investors to seek the advice of a financial advisor. Oppenheimer & Co. Inc. will not treat non-client recipients as its clients solely by virtue of their receiving this report. Past performance is not a guarantee of future results, and no representation or warranty, express or implied, is made regarding future performance of any security mentioned in this report. The price of the securities mentioned in this report and the income they produce may fluctuate and/or be adversely affected by exchange rates, and investors may realize losses on investments in such securities, including the loss of investment principal.
Oppenheimer & Co. Inc. accepts no liability for any loss arising from the use of information contained in this report. All information, opinions and statistical data contained in this report were obtained or derived from public sources believed to be reliable, but Oppenheimer & Co. Inc. does not represent that any such information, opinion or statistical data is accurate or complete and they should not be relied upon as such. All estimates and opinions expressed herein constitute judgments as of the date of this report and are subject to change without notice. Nothing in this report constitutes legal, accounting or tax advice. Since the levels and bases of taxation can change, any reference in this report to the impact of taxation
INVESTMENT STRATEGY
should not be construed as offering tax advice on the tax consequences of investments. As with any investment having potential tax implications, clients should consult with their own independent tax adviser.
This report may provide addresses of, or contain hyperlinks to, Internet web sites. Oppenheimer & Co. Inc. has not reviewed the linked Internet web site of any third party and takes no responsibility for the contents thereof. Each such address or hyperlink is provided solely for the recipient's convenience and information, and the content of linked third party web sites is not in any way incorporated into this document. Recipients who choose to access such third-party web sites or follow such hyperlinks do so at their own risk. The S&P 500 Index is an unmanaged value-weighted index of 500 common stocks that is generally considered representative of the U.S. stock market. The S&P 500 index figures do not reflect any fees, expenses or taxes. This research is distributed in the UK and elsewhere throughout Europe, as third party research by Oppenheimer Europe Ltd, which is authorized and regulated by the Financial Conduct Authority (FCA). This research is for information purposes only and is not to be construed as a solicitation or an offer to purchase or sell investments or related financial instruments. This report is for distribution only to persons who are eligible counterparties or professional clients and is exempt from the general restrictions in section 21 of the Financial Services and Markets Act 2000 on the communication of invitations or inducements to engage in investment activity on the grounds that it is being distributed in the UK only to persons of a kind described in Article 19(5) (Investment Professionals) and 49(2) High Net Worth companies, unincorporated associations etc.) of the Financial Services and Markets Act 2000 (Financial Promotion) Order 2005 (as amended). It is not intended to be distributed or passed on, directly or indirectly, to any other class of persons. In particular, this material is not for distribution to, and should not be relied upon by, retail clients, as defined under the rules of the FCA. Neither the FCA’s protection rules nor compensation scheme may be applied. This report or any portion hereof may not be reprinted, sold, or redistributed without the written consent of Oppenheimer & Co. Inc. Copyright © Oppenheimer & Co. Inc. 2015.
