Everyday, Everyday I Have the Blues
By John Stoltzfus,
Chief Investment Strategist
Ain’t No Cure for the Summertime Blues
As the June and Q2 came to a close, the bears growled louder

At the start of a holiday-abridged week (with the US celebrating Independence Day on Wednesday, July 4), we are reminded that traditionally many traders and investors extend the holiday to the days around the celebration, particularly when it occurs mid-week. This year could bring an exception to that Wall Street tradition due to escalating trade tensions, in particular the July 6 tariff deadline that is looming over US trading relationships across the globe. With the US preparing to level $34 billion in tariffs this week on China, that country has pledged retaliation; meanwhile, Europe, Canada and Mexico are waiting in the wings to adopt their own countermeasures against US tariffs as well. Indeed, on Friday Canada announced that it would impose $12.6 billion USD of tariffs on US products to take effect on Sunday, Canada’s July 1 national holiday.
Will ironies ever cease?
The yield on the 10-year Treasury has moved lower in each of the last three consecutive weeks; this has led to a flattening of the yield curve as the spread between the 10-year and 2-year note narrowed to its lowest level since 2007, adding to investor concerns about the possibility of the yield curve inverting and it signaling a recession in the year ahead or in 2020.
Ironically, the possibility of an actual trade war might divert market participants’ attention from their concerns about this persistent flattening of the yield curve as traders and investors might instead turn to ponder the potential impact on economic growth that a prolonged escalation of hostilities around trade might have (or is even already having) on business and consumer sentiment. A slowing rate of growth for the economy could in effect slow the Fed’s already modest pace of normalization as well as foreign central bankers’ respective normalization activities already in process or planned. (See page 3 of this report for more on our view on the yield curve and what it might be saying lies ahead for the US economy).
“We think there are compelling reasons to suspect that this time a yield curve inversion might not portend to a recession over the medium term.”
The Week Ahead
This week look for Thursday to be the focal point for the markets, when the Fed releases the minutes from its June FOMC meeting. It’s worth noting that last week two Federal Reserve regional bank presidents highlighted that trade friction has already begun to weigh on businesses and is casting a negative pall over the outlook on the economy. Likely, market participants will then turn their attention to Friday’s nonfarm payrolls report for June; Bloomberg’s survey shows a Street consensus average forecast for a 190,000 worker gain with the jobless rate unchanged from the prior month at 3.8%.
When it rains, it pours
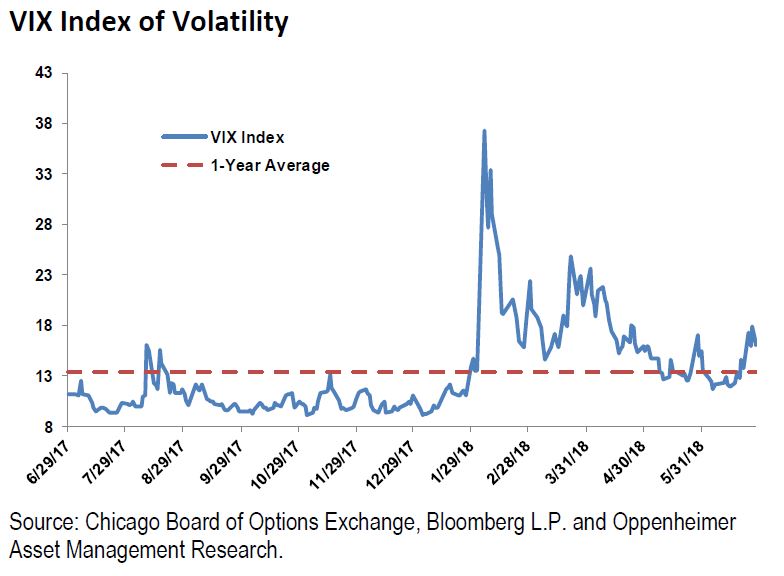
The VIX index jumped higher last week, rising 17% above the prior week to just over 16 (see figure below) as worries tied to trade war escalation, higher oil prices (WTI closing last Friday at its highest price since January of 2015) and sundry other issues that highlighted downside risks for economic and earnings growth.
Among the sundry other issues that rattled the market last week was news that Amazon (AMZN) planned to buy PillPack, a Boston-based start-up pharmacy for an estimated $1 billion. The announcement sent PBMs (pharmaceutical benefits managers), and other drug store-related stocks including pharmaceuticals into a tailspin on competition worries.
Added worry for the markets also stemmed from a number of vehicle manufacturers (including GM, Daimler, Toyota and Harley Davidson) that expressed serious concerns about the potential negative effects of increased import tariffs on their businesses. Among the issues cited include that these tariffs reduce their competitive positioning and could even force them to reduce their US presence as manufacturers and subsequently employers in the US. The fact that many major automakers import both some vehicles they sell and the parts they use in manufacturing them in the States is challenging the practicality of the Trump Administration’s process of addressing trade issues that exist between the US and its global trading partners and among its domestic producers.
Musings on the Second Quarter
So far the first half of the year has been a mixed bag for the equity markets stateside and globally.
The US market has shown considerable resilience under pressure through a number of fits and starts and serious challenges in no small part we believe attributable to stateside tax reform, a reduction in regulations, and economic and corporate fundamentals that have yet to show signs of serious deterioration if indeed some slowing.
Corporate and economic data that lies ahead, including Q2 GDP numbers and Q2 earnings season results, could provide some relief from the recent tariff/trade storm near term.
As of the end of the second quarter, the S&P 500, the S&P 400 (mid-caps), the Russell 2000 (small-caps), and the NASDAQ Composite showed positive returns from the start of the year, respectively higher: 1.7%, 2.7%, 7.0% and 8.8%. Among the major indices stateside the Dow Jones Industrial Average was the only one showing a loss in the same period, down 1.8% from the start of the year.
The major International indices, however, all posted losses for the year to date through the end of the second quarter with MSCI EAFE (developed markets ex-US and Canada), the MSCI Emerging Markets and the MSCI Frontier markets respectively off 4.5%, 7.9% and 13.1%.
A good portion of the losses reflected in the returns of the international equity indices reflects the recent strength of the dollar, which reduces gains and increases losses for Americans holding international stocks when performance is translated into US dollars. (See our currency table on page 5 of this report.)
The potential impact of tariffs on foreign stocks has also affected international equities, many of which have a significant exposure to exporting. Slower growth in a number of foreign countries for domestic and regional reasons has also impacted international stocks in the second quarter and first half of the year.
Our expectations remain for some progress in resolving the current trade issues that are negatively impacting these international groups to alleviate the downside pressure seen so far this year. Attractive valuations, longer term cyclical trends as well as secular trends (particularly for the emerging and frontier markets) augur significant opportunity in our opinion for investors willing to exercise patience.
For the complete report, please contact your Oppenheimer Financial Advisor.
Other Disclosures
This report is issued and approved by Oppenheimer & Co. Inc., a member of all Principal Exchanges, and SIPC. This report is distributed by Oppenheimer & Co. Inc., for informational purposes only, to its institutional and retail investor clients. This report does not constitute an offer or solicitation to buy or sell any securities discussed herein in any jurisdiction where such offer or solicitation would be prohibited. The securities mentioned in this report may not be suitable for all types of investors. This report does not take into account the investment objectives, financial situation or specific needs of any particular client of Oppenheimer & Co. Inc. Recipients should consider this report as only a single factor in making an investment decision and should not rely solely on investment recommendations contained herein, if any, as a substitution for the exercise of independent judgment of the merits and risks of investments. The strategist writing this report is not a person or company with actual, implied or apparent authority to act on behalf of any issuer mentioned in the report. Before making an investment decision with respect to any security discussed in this report, the recipient should consider whether such investment is appropriate given the recipient's particular investment needs, objectives and financial circumstances. We recommend that investors independently evaluate particular investments and strategies, and encourage investors to seek the advice of a financial advisor. Oppenheimer & Co. Inc. will not treat non-client recipients as its clients solely by virtue of their receiving this report. Past performance is not a guarantee of future results, and no representation or warranty, express or implied, is made regarding future performance of any security mentioned in this report. The price of the securities mentioned in this report and the income they produce may fluctuate and/or be adversely affected by exchange rates, and investors may realize losses on investments in such securities, including the loss of investment principal.
Oppenheimer & Co. Inc. accepts no liability for any loss arising from the use of information contained in this report. All information, opinions and statistical data contained in this report were obtained or derived from public sources believed to be reliable, but Oppenheimer & Co. Inc. does not represent that any such information, opinion or statistical data is accurate or complete and they should not be relied upon as such. All estimates and opinions expressed herein constitute judgments as of the date of this report and are subject to change without notice. Nothing in this report constitutes legal, accounting or tax advice. Since the levels and bases of taxation can change, any reference in this report to the impact of taxation
INVESTMENT STRATEGY
should not be construed as offering tax advice on the tax consequences of investments. As with any investment having potential tax implications, clients should consult with their own independent tax adviser.
This report may provide addresses of, or contain hyperlinks to, Internet web sites. Oppenheimer & Co. Inc. has not reviewed the linked Internet web site of any third party and takes no responsibility for the contents thereof. Each such address or hyperlink is provided solely for the recipient's convenience and information, and the content of linked third party web sites is not in any way incorporated into this document. Recipients who choose to access such third-party web sites or follow such hyperlinks do so at their own risk. The S&P 500 Index is an unmanaged value-weighted index of 500 common stocks that is generally considered representative of the U.S. stock market. The S&P 500 index figures do not reflect any fees, expenses or taxes. This research is distributed in the UK and elsewhere throughout Europe, as third party research by Oppenheimer Europe Ltd, which is authorized and regulated by the Financial Conduct Authority (FCA). This research is for information purposes only and is not to be construed as a solicitation or an offer to purchase or sell investments or related financial instruments. This report is for distribution only to persons who are eligible counterparties or professional clients and is exempt from the general restrictions in section 21 of the Financial Services and Markets Act 2000 on the communication of invitations or inducements to engage in investment activity on the grounds that it is being distributed in the UK only to persons of a kind described in Article 19(5) (Investment Professionals) and 49(2) High Net Worth companies, unincorporated associations etc.) of the Financial Services and Markets Act 2000 (Financial Promotion) Order 2005 (as amended). It is not intended to be distributed or passed on, directly or indirectly, to any other class of persons. In particular, this material is not for distribution to, and should not be relied upon by, retail clients, as defined under the rules of the FCA. Neither the FCA’s protection rules nor compensation scheme may be applied. This report or any portion hereof may not be reprinted, sold, or redistributed without the written consent of Oppenheimer & Co. Inc. Copyright © Oppenheimer & Co. Inc. 2015.
