Everyday, Everyday I Have the Blues
By John Stoltzfus,
Chief Investment Strategist
You Can’t Always Get What You Want
Economies and central bank policies in transition spawn price discovery and volatility

After longing for a 10% correction to cool the market’s run-up in the first four weeks of January, a correction was realized. It seems ironic to us that some of the same voices that had cried out for a correction of 6-10% “to return reason to the market” now apparently feel that what came to pass was not enough.
Even as stocks advanced last week skeptics and bears were calling for a need to see a “W-” shaped recovery in stock prices instead of the “V’ shaped recovery the markets delivered stateside through last Friday.
The six-day rally for the S&P 500 from a recent low on February 8th through last Friday has stock market bears all a-twitter as they question the veracity of the rally even as economic data persists positive and fourth-quarter earnings season (with 400 of 500 S&P 500 companies thus far reported) show Q4 earnings up over 15% on the back of revenue growth just above 8%.
While core CPI came in slightly higher than expected (at 1.8% YoY versus 1.7% expected in a Bloomberg survey of economists), the inflation read looks to us as simply reflationary and showing signs that the Federal Reserve’s 2% target on this gauge of inflation is likely to be met this year.
Until the recently sworn in Fed Chair (Jerome Powell) has opportunity to prove his mettle with observers and market participants it is likely that volatility will persist as denizens of the market test the new chairman for signs of weakness.
At times of transition whether it’s via the process of interest rate normalization engineered by monetary policy makers, or wage acceleration in a post recovery expansion or commodity price movements as a global economic recovery gains traction, there is to be expected a pick-up in volatility as the process of price discovery runs through asset classes and the markets that trade them.
At times like these it’s important for investors to recognize the distinction between shortterm trading and intermediate- and long-term investing.
“While many investors may cringe at even the thought of a possible jump in volatility, experienced investors tend to sense opportunities to find stocks that they may have found earlier to be priced out of reach at more attractive levels.”
Distinguishing the difference between traders and investors is not so much a question of semantics but rather an important reality check to avoid near-term disturbances. It’s also key to avoiding overly dramatic reactions to jumps in market volatility that can throw investors off guard and cause them to miss seeing the opportunities while staying too focused on apparent risks.
We often hear market commentators and pundits say “the markets don’t like uncertainty.” And yet our experience of nearly 35 years as investment professionals tells us that in reality (particularly in the realty of hindsight) markets thrive if not “on volatility” but “from volatility.”
Traders thrive on volatility. In our conversations with traders over the past few weeks we found none too few who were happy with the jump in volatility as it raised opportunities for traders to “do their thing.”
While many investors may cringe at even the thought of a possible jump in volatility, more experienced investors tend to sense opportunities to find stocks that they may have found earlier to be priced out of reach at more attractive levels.
As of last Friday the S&P 500 had regained around half of what it had given back in the pullback from January 26 through February 8. For investors who have found it comfortable to “buy the dips” in earlier sell offs there appears to still be “some of the dip” left to take advantage of.
Last week through Friday the Dow Jones Industrial Average, The S&P 500, the S&P 400 (Mid-caps), the Russell 2000 (small caps) and the Nasdaq Composite (around 40% tech related) were up respectively 5.7%, 5.8% 5.6%, 5.5% and 6.8%. Those same indices stand as of last Friday respectively off from their January 26 highs: 5.25%, 4.9%, 4.7%, 4.9% and 3.6%.
Whether it’s a “V” shaped rally that remains in progress or a “W ”shaped rally that’s about to take shape, the economic and corporate fundamentals remain supportive for stocks to move higher over the course of this year notwithstanding some unforeseen reversal that could cause fundamentals to deteriorate. We reiterate our 2018 price target for the S&P 500 (which we initiated in December of last year) of 3000 with our expectations for S&P 500 earnings to rise to $145 per share.
As traders and investors stateside return to a President’s Day holiday-abridged four day trading week they’ll be watching Q4 earnings season entering the home stretch, keeping an eye on the economic data crossing the transom, January’s FOMC meeting minutes (released on Wednesday) and measuring the success of scheduled Treasury auctions. Key Asian markets begin to return on line this week from the Lunar New Year holiday.
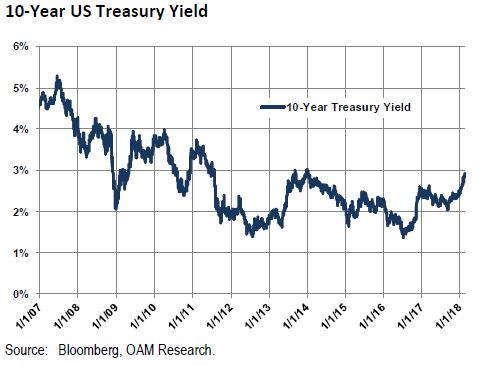
Time to Remember
In the last cycle stocks didn’t begin to run into trouble until a few months after the 10-year Treasury crossed 5.3% in June of 2007. Stocks had moved higher through two years of rate hikes (17 increases in the Fed Funds rate taking the rate from 1% at the end of June 2004 to 5.25% at the end of June 2006). The 10-year Treasury yield caught up with the Fed Funds rate yield just under a year later. Subprime adjustable rate mortgages felt the effect and shortly thereafter fundamentals began to deteriorate pushing the Fed to cut its Fed Funds rate in September of 2007. Stocks began to weaken from that point through December of 2007 when the US entered the Great Recession.
Corporate Earnings Remain Strong
Q4 results for companies in the S&P 500 (with some 400 of 500 companies thus far reported through last Friday) show earnings growth of 15.2% in the last quarter on the back of an 8.1% increase in revenues in the same period. Five of the benchmark’s 11 sectors have thus far reported double digit earnings growth for Q4 and one (energy) has reported triple digit growth. (See page 4 of this report for details.)
For the complete report, please contact your Oppenheimer Financial Advisor.<
Other Disclosures
This report is issued and approved by Oppenheimer & Co. Inc., a member of all Principal Exchanges, and SIPC. This report is distributed by Oppenheimer & Co. Inc., for informational purposes only, to its institutional and retail investor clients. This report does not constitute an offer or solicitation to buy or sell any securities discussed herein in any jurisdiction where such offer or solicitation would be prohibited. The securities mentioned in this report may not be suitable for all types of investors. This report does not take into account the investment objectives, financial situation or specific needs of any particular client of Oppenheimer & Co. Inc. Recipients should consider this report as only a single factor in making an investment decision and should not rely solely on investment recommendations contained herein, if any, as a substitution for the exercise of independent judgment of the merits and risks of investments. The strategist writing this report is not a person or company with actual, implied or apparent authority to act on behalf of any issuer mentioned in the report. Before making an investment decision with respect to any security discussed in this report, the recipient should consider whether such investment is appropriate given the recipient's particular investment needs, objectives and financial circumstances. We recommend that investors independently evaluate particular investments and strategies, and encourage investors to seek the advice of a financial advisor. Oppenheimer & Co. Inc. will not treat non-client recipients as its clients solely by virtue of their receiving this report. Past performance is not a guarantee of future results, and no representation or warranty, express or implied, is made regarding future performance of any security mentioned in this report. The price of the securities mentioned in this report and the income they produce may fluctuate and/or be adversely affected by exchange rates, and investors may realize losses on investments in such securities, including the loss of investment principal.
Oppenheimer & Co. Inc. accepts no liability for any loss arising from the use of information contained in this report. All information, opinions and statistical data contained in this report were obtained or derived from public sources believed to be reliable, but Oppenheimer & Co. Inc. does not represent that any such information, opinion or statistical data is accurate or complete and they should not be relied upon as such. All estimates and opinions expressed herein constitute judgments as of the date of this report and are subject to change without notice. Nothing in this report constitutes legal, accounting or tax advice. Since the levels and bases of taxation can change, any reference in this report to the impact of taxation
INVESTMENT STRATEGY
should not be construed as offering tax advice on the tax consequences of investments. As with any investment having potential tax implications, clients should consult with their own independent tax adviser.
This report may provide addresses of, or contain hyperlinks to, Internet web sites. Oppenheimer & Co. Inc. has not reviewed the linked Internet web site of any third party and takes no responsibility for the contents thereof. Each such address or hyperlink is provided solely for the recipient's convenience and information, and the content of linked third party web sites is not in any way incorporated into this document. Recipients who choose to access such third-party web sites or follow such hyperlinks do so at their own risk. The S&P 500 Index is an unmanaged value-weighted index of 500 common stocks that is generally considered representative of the U.S. stock market. The S&P 500 index figures do not reflect any fees, expenses or taxes. This research is distributed in the UK and elsewhere throughout Europe, as third party research by Oppenheimer Europe Ltd, which is authorized and regulated by the Financial Conduct Authority (FCA). This research is for information purposes only and is not to be construed as a solicitation or an offer to purchase or sell investments or related financial instruments. This report is for distribution only to persons who are eligible counterparties or professional clients and is exempt from the general restrictions in section 21 of the Financial Services and Markets Act 2000 on the communication of invitations or inducements to engage in investment activity on the grounds that it is being distributed in the UK only to persons of a kind described in Article 19(5) (Investment Professionals) and 49(2) High Net Worth companies, unincorporated associations etc.) of the Financial Services and Markets Act 2000 (Financial Promotion) Order 2005 (as amended). It is not intended to be distributed or passed on, directly or indirectly, to any other class of persons. In particular, this material is not for distribution to, and should not be relied upon by, retail clients, as defined under the rules of the FCA. Neither the FCA’s protection rules nor compensation scheme may be applied. This report or any portion hereof may not be reprinted, sold, or redistributed without the written consent of Oppenheimer & Co. Inc. Copyright © Oppenheimer & Co. Inc. 2015.
