Everyday, Everyday I Have the Blues
By John Stoltzfus,
Chief Investment Strategist
How Long Has This Been Going On?
Stocks rising on a nearly daily basis so far this year cause traders and investors to ponder

Three weeks into the year and major global equity benchmarks show stocks posting weekly gains and new record highs for three consecutive weeks. Some market observers have expressed concern and are calling the recent action in stateside stocks a market “melt-up.” At this time we see not so much a melt-up as a market “catch-up” with developments that appear more positive than negative for equity performance.
Though it’s very early into the Q4 earnings season revenues and earnings so far are broadly showing continued improvement. The first indications (garnered from company calls, analyst reports and investor responses) are that the new tax reform package looks positive for most companies (and for some not immediately, but over the near term). Another factor likely contributing to recent gains in the equity markets has been in our opinion the beginning of a process of capitulation by some bull market skeptics and bears.
Economic data persists in signaling sustainable economic growth stateside and positive growth abroad across the regions of the world. Even as growth improves inflation remains at levels more “reflationary” than “inflationary” making the Fed’s role easier to manage.
While politics, geopolitics and uncertainties of all ilk abound and signal that not everything is “a bed of roses,” business conditions and the outlook for moderate growth appear good. Sustainable economic growth along with revenue and earnings growth historically are key ingredients for making stocks attractive to investors. Until fundamentals show signs of deterioration a positive environment for stocks is likely to persist.
With inflation rising at a pace below the Fed’s target rate, that institution’s goal—to normalize interest rates without sending the economy into a tailspin—continues to appear to us achievable if not quite yet at hand just shy of nine years after the Great Recession ended.
Last week the Dow Jones Industrial Average closed above 26,000 mid-week to reach yet another record high. While the distance from 25,000 to 26,000 spanned just eight trading days, the actual percentage gain (4%) was not quite as striking as the fanfare around the benchmark’s arrival at its new plateau. Still the arrival at that latest watermark level caused at least some investors to question just how much higher the current upside streak could last.
“We expect that equity markets will continue to seek out catalysts for the direction they will take next. So far in these first few weeks of the 2018 that direction has pointed higher. Time will tell.”
The gains so far haven’t been limited to large cap stocks but have been spread across market capitalizations and across borders. Last Friday the S&P 500, the S&P 400 (mid-caps), the Russell 2000 (small caps), the tech laden NASDAQ Composite as well as MSCI EAFE (developed markets ex-US and Canada), and MSCI Emerging markets all closed at respective record highs. The Dow Jones Industrial average and the MSCI Frontier markets closed slightly below their latest record levels achieved earlier last week.
We found it interesting that the consecutive weekly gains posted by the aforementioned markets showed a slowing in these gains from week to week for six of the eight benchmarks—indicating to us that an element of buyers’ fatigue may be settling in even while what some pundits coined “FOMO” (Fear of Missing Out) remains trending.
The respective weekly gains posted by the major indices so far in 2018 are as follows:
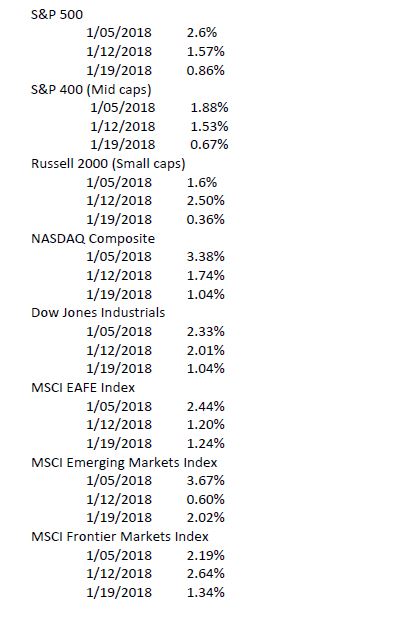
We expect that equity markets will continue to seek out catalysts for the direction they will take next. So far in these first few weeks of 2018 that direction has pointed higher. Time will tell.
News Crossing the Tape Late Evening on Sunday
On Sunday night as we went to press with this week’s edition of the MSRS news crossed the tape that the Senate failed to end the government shutdown which began at midnight last Friday. We expect that the overhang of this year’s mid-term election in November will provide increasing pressure on Washington D.C. politicians from both sides of the aisle the longer the issues that led to the government shutdown remain unresolved.
That said, it’s worth noting that the last shutdown of the US government in 2013 took place from October 1 through 16. In that period the S&P 500, the S&P 400 (mid caps), the Russell 2000, the NASDAQ Composite and the Dow Jones Industrials respectively advanced 1.57%, 0.54%, 0.46%, 0.56% and 1.20%.
In 2013 those same indices respectively advanced: 29.6%, 31.6%, 37%, 38.32% and 26.5% for the full year notwithstanding the effects of a 16-day government shutdown as well as an unrelated jump in the yield of the 10-year Treasury note which went from a low of 1.63% in early May of that year to 3.03% on December 31 of that year.
While this week could see markets react negatively to the current shutdown, we are planning to avoid jumping to conclusions as news from Washington, DC grabs some degree of the markets’ attention.
For the complete report, please contact your Oppenheimer Financial Advisor.
Other Disclosures
This report is issued and approved by Oppenheimer & Co. Inc., a member of all Principal Exchanges, and SIPC. This report is distributed by Oppenheimer & Co. Inc., for informational purposes only, to its institutional and retail investor clients. This report does not constitute an offer or solicitation to buy or sell any securities discussed herein in any jurisdiction where such offer or solicitation would be prohibited. The securities mentioned in this report may not be suitable for all types of investors. This report does not take into account the investment objectives, financial situation or specific needs of any particular client of Oppenheimer & Co. Inc. Recipients should consider this report as only a single factor in making an investment decision and should not rely solely on investment recommendations contained herein, if any, as a substitution for the exercise of independent judgment of the merits and risks of investments. The strategist writing this report is not a person or company with actual, implied or apparent authority to act on behalf of any issuer mentioned in the report. Before making an investment decision with respect to any security discussed in this report, the recipient should consider whether such investment is appropriate given the recipient's particular investment needs, objectives and financial circumstances. We recommend that investors independently evaluate particular investments and strategies, and encourage investors to seek the advice of a financial advisor. Oppenheimer & Co. Inc. will not treat non-client recipients as its clients solely by virtue of their receiving this report. Past performance is not a guarantee of future results, and no representation or warranty, express or implied, is made regarding future performance of any security mentioned in this report. The price of the securities mentioned in this report and the income they produce may fluctuate and/or be adversely affected by exchange rates, and investors may realize losses on investments in such securities, including the loss of investment principal.
Oppenheimer & Co. Inc. accepts no liability for any loss arising from the use of information contained in this report. All information, opinions and statistical data contained in this report were obtained or derived from public sources believed to be reliable, but Oppenheimer & Co. Inc. does not represent that any such information, opinion or statistical data is accurate or complete and they should not be relied upon as such. All estimates and opinions expressed herein constitute judgments as of the date of this report and are subject to change without notice. Nothing in this report constitutes legal, accounting or tax advice. Since the levels and bases of taxation can change, any reference in this report to the impact of taxation
INVESTMENT STRATEGY
should not be construed as offering tax advice on the tax consequences of investments. As with any investment having potential tax implications, clients should consult with their own independent tax adviser.
This report may provide addresses of, or contain hyperlinks to, Internet web sites. Oppenheimer & Co. Inc. has not reviewed the linked Internet web site of any third party and takes no responsibility for the contents thereof. Each such address or hyperlink is provided solely for the recipient's convenience and information, and the content of linked third party web sites is not in any way incorporated into this document. Recipients who choose to access such third-party web sites or follow such hyperlinks do so at their own risk. The S&P 500 Index is an unmanaged value-weighted index of 500 common stocks that is generally considered representative of the U.S. stock market. The S&P 500 index figures do not reflect any fees, expenses or taxes. This research is distributed in the UK and elsewhere throughout Europe, as third party research by Oppenheimer Europe Ltd, which is authorized and regulated by the Financial Conduct Authority (FCA). This research is for information purposes only and is not to be construed as a solicitation or an offer to purchase or sell investments or related financial instruments. This report is for distribution only to persons who are eligible counterparties or professional clients and is exempt from the general restrictions in section 21 of the Financial Services and Markets Act 2000 on the communication of invitations or inducements to engage in investment activity on the grounds that it is being distributed in the UK only to persons of a kind described in Article 19(5) (Investment Professionals) and 49(2) High Net Worth companies, unincorporated associations etc.) of the Financial Services and Markets Act 2000 (Financial Promotion) Order 2005 (as amended). It is not intended to be distributed or passed on, directly or indirectly, to any other class of persons. In particular, this material is not for distribution to, and should not be relied upon by, retail clients, as defined under the rules of the FCA. Neither the FCA’s protection rules nor compensation scheme may be applied. This report or any portion hereof may not be reprinted, sold, or redistributed without the written consent of Oppenheimer & Co. Inc. Copyright © Oppenheimer & Co. Inc. 2015.
