Everyday, Everyday I Have the Blues
By John Stoltzfus,
Chief Investment Strategist
A Tale of Two Markets
One driven by negative projections, the other by improving economic data
From the start of the year through the end of the first quarter, the market made what was essentially a “round trip” of a roller coaster-like ride in Q1.
As a result, investor sentiment in the first segment of the year within relatively short periods of time moved from “risk-on” to “risk-off” and back again.
But for all the drama to the downside at the start of the year, by the time the dust settled, eight (or more than half at 57.1%) of the 14 weeks that ended within the quarter had seen the S&P 500 deliver positive returns on a weekly return basis.
Six (or less than half at 42.9%) of the 14 weeks ended in the first quarter saw the broad market lose ground. In one of those down weeks (and a little more than a month before the market started its powerful rally), stocks fell nearly 6%, causing no small degree of drama and concern.
All told, stocks were in a downward trend from the last day in 2015 through February 11, 2016 as the market fell 10.51%, weighed down by: concerns over economic growth (including a misperception by many investors that we were headed into if not already in recession), further weakening in international currencies against a strong dollar and plunging commodities’ prices, led by oil, which took investor focus and opinion hostage.
Then things suddenly appeared to change. Or was it just a change of perception and projection?
From the low established on Feb. 11th through the last day of trading in the first quarter, the S&P 500 rallied 12.61%, ending the quarter just 0.77% above where it started the year, effectively having made just a little bit better than a round trip from where it ended the fourth quarter of 2015.
Improving stateside economic data along with actions taken (and not taken) by central bankers in places as distant as the US, Europe, the UK, Japan and China turned the beat around, and the market changed direction to march to the beat of a different drummer.
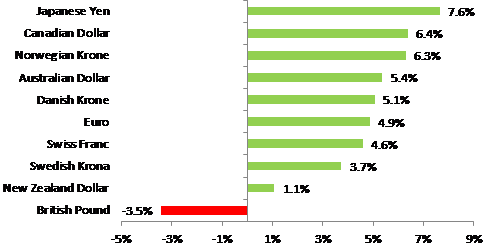
Change in Currency Value versus US Dollar in Year to Date through April 1, 2016
G-10 Currencies:
Emerging Market Nation Currencies:
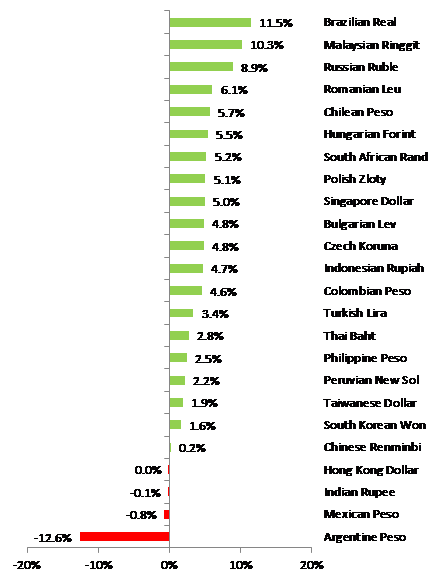
Source: Bloomberg, OAM Research.
Last Friday, the first day of April, the market advanced a little over three-quarters of a percent on the day, closing at 2072.78, or 1.41% above where it had started the year and just 2.7% below its record high of 2,130.82 set last May.
Among the factors that caused the market to change direction and move higher we’d include:
From the equity market’s low point on February 11th, stocks rallied globally, led by the US, with the S&P 500, the S&P 400 (mid-caps) and the Russell 2000 (small-caps) respectively moving 12.61%, 16.66% and 16.81% higher.
Foreign markets as represented by the MSCI EAFE (developed markets ex-US and Canada), the MSCI Emerging Markets index and the MSCI Frontier markets index rallied 10.48%, 17.36% and 3.11% respectively.
Russell Growth and Value Indexes YTD
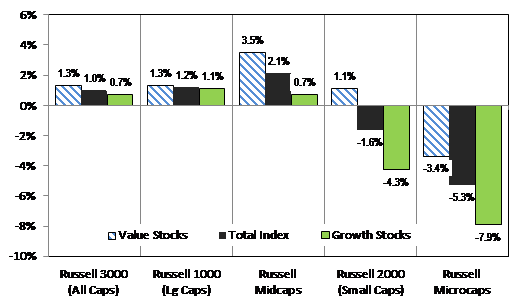
Source: Russell Associates, Bloomberg and OAM Research. Change in index values from 12/31/2015 to 4/1/2016
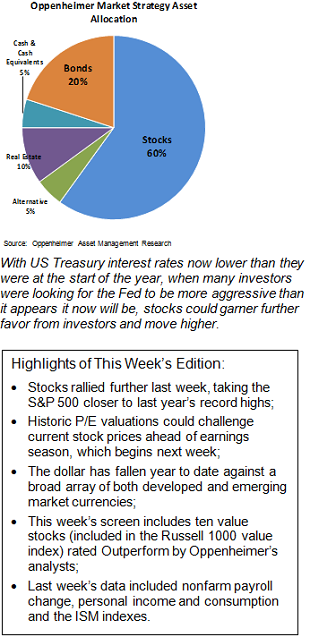
With US benchmark Treasury interest rates now lower than they were at the start of the year, when many investors were looking for the Fed to be more aggressive than it appears it now will be near term and perhaps for the rest of this year, stocks could garner further favor from investors and move higher.
Consider that 2-year, the 5-year, the 10-year and the 30-year Treasury yields are down from their respective highs at the start of the year with (as we go to press):
The next hurdle on the wall of worry for stocks is likely valuation as Q1 earnings season comes up on the horizon.
Q1 earnings season will unofficially start when Alcoa (AA) reports results a week from today after the market close on April 11th.
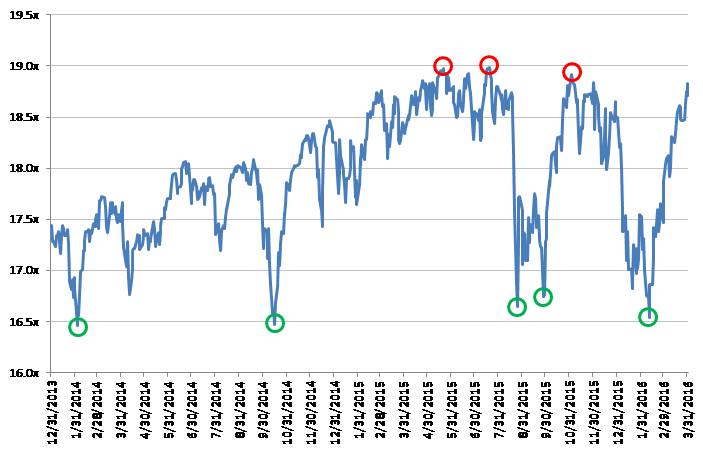
As of last Friday, April 1st, the 12-month trailing P/E multiple of the S&P 500 stood at 18.83x, up from a 2016 low of 16.54x on February 11th of this year (see figure below).
S&P 500 Index Trailing P/E Since 2014
Source: Bloomberg, OAM Research.
The average 12-month trailing multiple of the S&P 500 all the way back to the end of 1965 stands at about 16.56x.
At 18.83x, Friday’s trailing 12-month P/E multiple stood at around a 13.7% premium to the market’s long-term average trailing 12- month multiple of 16.54x, and the market (as illustrated by the performance of the S&P 500) has shown resistance to pushing through a level of 19x since February of 2014 (again see figure at left).
That said, the average yield on the 10-year Treasury note since the end of 1965 through last Friday stands at 6.54% versus a current yield on the 10-year of around 1.77%
While economic, revenue and earnings growth are principal factors that move stocks higher, the relative value of asset classes and their respective prospects for better returns can serve as near-term factors determining which asset classes are favored by investors.
Stay tuned.
For the complete report, please contact your Oppenheimer Financial Advisor.
Potential Conflicts of Interest
Strategic analysts employed by Oppenheimer & Co. Inc. are compensated from revenues generated by the firm. Oppenheimer & Co. Inc. generally prohibits strategists and members of his or her households from executing trades in the securities of a company that is discussed in a strategy report. . Recipients of this report are advised that any or all of the foregoing as well as more specific disclosures set forth below, may at times give rise to potential conflicts of interest.
Other Disclosures
This report is issued and approved by Oppenheimer & Co. Inc., a member of all Principal Exchanges, and SIPC. This report is distributed by Oppenheimer & Co. Inc., for informational purposes only, to its institutional and retail investor clients. This report does not constitute an offer or solicitation to buy or sell any securities discussed herein in any jurisdiction where such offer or solicitation would be prohibited. The securities mentioned in this report may not be suitable for all types of investors. This report does not take into account the investment objectives, financial situation or specific needs of any particular client of Oppenheimer & Co. Inc. Recipients should consider this report as only a single factor in making an investment decision and should not rely solely on investment recommendations contained herein, if any, as a substitution for the exercise of independent judgment of the merits and risks of investments. The strategist writing this report is not a person or company with actual, implied or apparent authority to act on behalf of any issuer mentioned in the report. Before making an investment decision with respect to any security discussed in this report, the recipient should consider whether such investment is appropriate given the recipient's particular investment needs, objectives and financial circumstances. We recommend that investors independently evaluate particular investments and strategies, and encourage investors to seek the advice of a financial advisor. Oppenheimer & Co. Inc. will not treat non-client recipients as its clients solely by virtue of their receiving this report. Past performance is not a guarantee of future results, and no representation or warranty, express or implied, is made regarding future performance of any security mentioned in this report. The price of the securities mentioned in this report and the income they produce may fluctuate and/or be adversely affected by exchange rates, and investors may realize losses on investments in such securities, including the loss of investment principal.
Oppenheimer & Co. Inc. accepts no liability for any loss arising from the use of information contained in this report. All information, opinions and statistical data contained in this report were obtained or derived from public sources believed to be reliable, but Oppenheimer & Co. Inc. does not represent that any such information, opinion or statistical data is accurate or complete and they should not be relied upon as such. All estimates and opinions expressed herein constitute judgments as of the date of this report and are subject to change without notice. Nothing in this report constitutes legal, accounting or tax advice. Since the levels and bases of taxation can change, any reference in this report to the impact of taxation
INVESTMENT STRATEGY
should not be construed as offering tax advice on the tax consequences of investments. As with any investment having potential tax implications, clients should consult with their own independent tax adviser.
This report may provide addresses of, or contain hyperlinks to, Internet web sites. Oppenheimer & Co. Inc. has not reviewed the linked Internet web site of any third party and takes no responsibility for the contents thereof. Each such address or hyperlink is provided solely for the recipient's convenience and information, and the content of linked third party web sites is not in any way incorporated into this document. Recipients who choose to access such third-party web sites or follow such hyperlinks do so at their own risk. The S&P 500 Index is an unmanaged value-weighted index of 500 common stocks that is generally considered representative of the U.S. stock market. The S&P 500 index figures do not reflect any fees, expenses or taxes. This research is distributed in the UK and elsewhere throughout Europe, as third party research by Oppenheimer Europe Ltd, which is authorized and regulated by the Financial Conduct Authority (FCA). This research is for information purposes only and is not to be construed as a solicitation or an offer to purchase or sell investments or related financial instruments. This report is for distribution only to persons who are eligible counterparties or professional clients and is exempt from the general restrictions in section 21 of the Financial Services and Markets Act 2000 on the communication of invitations or inducements to engage in investment activity on the grounds that it is being distributed in the UK only to persons of a kind described in Article 19(5) (Investment Professionals) and 49(2) High Net Worth companies, unincorporated associations etc.) of the Financial Services and Markets Act 2000 (Financial Promotion) Order 2005 (as amended). It is not intended to be distributed or passed on, directly or indirectly, to any other class of persons. In particular, this material is not for distribution to, and should not be relied upon by, retail clients, as defined under the rules of the FCA. Neither the FCA’s protection rules nor compensation scheme may be applied. This report or any portion hereof may not be reprinted, sold, or redistributed without the written consent of Oppenheimer & Co. Inc. Copyright © Oppenheimer & Co. Inc. 2015.
