Everyday, Everyday I Have the Blues
By John Stoltzfus,
Chief Investment Strategist
Not so much about the elephant in the living room
It’s the boat in the basement that is the issue
With not all that much fanfare last week, US stocks celebrated the seventh anniversary of the bull market that began after the broad market closed at a low of 676.53 on March 9, 2009.
A combination of the housing and leverage bubble that had peaked in 2006 into 2007 and then burst into the worst financial crisis in 2008 since the Great Depression hurled the S&P 500 down 56.8% from a cyclical peak of 1565.15, where it had been perched on October 9, 2007.
In the historical aggregate, we can’t help but think that the broad market’s performance since that low in March of 2009 is too often mislabeled a “great bull market” that has nearly tripled the level at which the S&P 500 traded from March 2009 rather than as what could more accurately be termed “a great bull market recovery.”
After all, while the S&P 500 at last Friday’s close of 2022.19 is 2.99 times the level at where the benchmark was on March 9, 2009, it is just under 30% from where it stood on October 9, 2007, the market’s pre-crisis cyclical peak.
That’s a 30% gain in a period of time that is just under 8.5 years. Such performance hardly smacks to us of irrational exuberance or hubristic behavior, but rather suggests a market that has gone through a major crisis and then has had to laboriously overcome challenges in its path to climb a wall of worry back to and then slightly above where it once stood.
A cumulative 29.2% gain in price won over 8.5 years reveals an average annual gain of 3.44% or an annual compounded return of 3.056%, not exactly the stuff of froth and hubris.
We’d propose that perhaps we are not so much at the latter part or the end of a great bull market (as some are only too eager to suggest), but rather at a crossroads at which the recovered market seeks a catalyst to point it in the right direction.
Along with last week’s market anniversary date came commentaries from a number of market observers that referenced the longevity of the market run-up from 2009 as “the second longest bull market in history,” implying that the length of time that has passed would likely limit how much further the market could run higher.
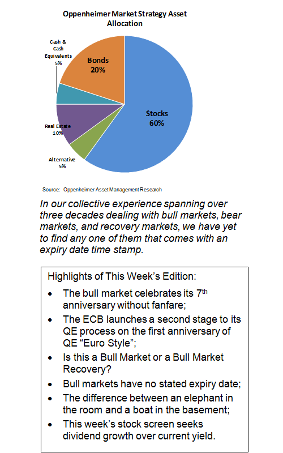
In our collective experience spanning over three decades dealing with bull markets, bear markets, and recovery markets we have yet to find any one of them that comes with an expiry date time stamp.
Rather we have found more accurate Mark Twain’s admonition that “history may not repeat itself but it often rhymes.”
With consideration of that thought we recall that market direction and longevity of established market trends tend to reflect:
We cite these among other factors that are taken into consideration by the markets and their investor constituencies in pricing the value of asset classes.
For now we’ll look to revenues and earnings growth and the direction of interest rates as signposts pointing to the direction of where stocks are likely to head.
With the Federal Reserve’s policy now data-dependent, with the dollar beginning to lose some strength against a number of both developed and emerging market currencies, and with foreign central banks outside of the US accommodative and vigilant against deflation, to our mind the bull market recovery may have longer legs than skeptics imagine.
Central Banks “Pushing on a string?”
We don’t think so. Through the events that unfolded in the period central to the great crisis and through the recovery process that ensued into the current economic expansion stateside, it was the efforts of the U.S. Federal Reserve via multiple rescue and recovery programs that were in our opinion (and in the opinion of many others) central in leading the stateside economy and markets to relative good health and where they are today.
The Fed’s key and most controversial efforts included:
While there are those who believe that the Federal Reserve’s QE programs were not effective, we would argue that the Fed’s efforts were remarkably effective and successful considering the breadth and depth of the systemic damage that had been sustained by the economy and the markets and which had to be addressed in an unprecedented manner due to the nature and scope of the challenge that was faced.
We would suggest that evidence of the success of the Fed’s efforts in repairing the damage done by the crisis and addressing the dysfunction that led up to it include:
While challenges will never cease (that’s the way of the world since time began), the progress that has been made since 2009 in our opinion supports an economic expansion, that while not robust, appears sustainable as evidenced by economic data and prospects for further growth.
Markets Focus on the ECB
Last week developments in Europe tied to the ECB’s QE program garnered the attention of global investors with the latest announcement from ECB President Mario Draghi.
In the latest chapter of the process in Europe the ECB announced that it will ramp up its bond-buying program from 60 billion euros per month to €80 billion per month (beginning in April) as it enters its second year of QE.
While the recovery process that is taking place in Europe trails the progress made by the US economy in the last few years, it is important to consider the structural challenges to effect QE over a union of separate countries, as well as the newness of the process in the region. It was just last March that the ECB announced that it would undertake a QE process to counter deflation and move toward reflating the economies of the region.
Investors initially celebrated last week’s announcement of the expansion of the ECB’s QE program, then they reconsidered it negatively, but by Friday decided to celebrate the process, sending European markets closing broadly higher, with gains that ranged by last Friday’s close from as little as 1.33% to as much as 4.8% on the day.
From our perch on the Market Radar Screen what’s key to the process is that action is being taken across the globe by central banks to restore economies to some degree of normalcy, even as developments in technology and globalization continue to raise challenges in the near term to prospects for economic reflation.
For now it is not about elephants in the living room (problems that are sizable but denied or unrecognized), but rather it is about the significant challenges that are well known but are being addressed and dealt with that matters.
We see it as analogous to dealing with a problem of a “boat in the basement” that needs to find a way to the water without shaking the foundations of the house.
No easy task, but one that is not insurmountable.
Stay tuned.
For the complete report, please contact your Oppenheimer Financial Advisor.
Potential Conflicts of Interest
Strategic analysts employed by Oppenheimer & Co. Inc. are compensated from revenues generated by the firm. Oppenheimer & Co. Inc. generally prohibits strategists and members of his or her households from executing trades in the securities of a company that is discussed in a strategy report. . Recipients of this report are advised that any or all of the foregoing as well as more specific disclosures set forth below, may at times give rise to potential conflicts of interest.
Other Disclosures
This report is issued and approved by Oppenheimer & Co. Inc., a member of all Principal Exchanges, and SIPC. This report is distributed by Oppenheimer & Co. Inc., for informational purposes only, to its institutional and retail investor clients. This report does not constitute an offer or solicitation to buy or sell any securities discussed herein in any jurisdiction where such offer or solicitation would be prohibited. The securities mentioned in this report may not be suitable for all types of investors. This report does not take into account the investment objectives, financial situation or specific needs of any particular client of Oppenheimer & Co. Inc. Recipients should consider this report as only a single factor in making an investment decision and should not rely solely on investment recommendations contained herein, if any, as a substitution for the exercise of independent judgment of the merits and risks of investments. The strategist writing this report is not a person or company with actual, implied or apparent authority to act on behalf of any issuer mentioned in the report. Before making an investment decision with respect to any security discussed in this report, the recipient should consider whether such investment is appropriate given the recipient's particular investment needs, objectives and financial circumstances. We recommend that investors independently evaluate particular investments and strategies, and encourage investors to seek the advice of a financial advisor. Oppenheimer & Co. Inc. will not treat non-client recipients as its clients solely by virtue of their receiving this report. Past performance is not a guarantee of future results, and no representation or warranty, express or implied, is made regarding future performance of any security mentioned in this report. The price of the securities mentioned in this report and the income they produce may fluctuate and/or be adversely affected by exchange rates, and investors may realize losses on investments in such securities, including the loss of investment principal.
Oppenheimer & Co. Inc. accepts no liability for any loss arising from the use of information contained in this report. All information, opinions and statistical data contained in this report were obtained or derived from public sources believed to be reliable, but Oppenheimer & Co. Inc. does not represent that any such information, opinion or statistical data is accurate or complete and they should not be relied upon as such. All estimates and opinions expressed herein constitute judgments as of the date of this report and are subject to change without notice. Nothing in this report constitutes legal, accounting or tax advice. Since the levels and bases of taxation can change, any reference in this report to the impact of taxation
INVESTMENT STRATEGY
should not be construed as offering tax advice on the tax consequences of investments. As with any investment having potential tax implications, clients should consult with their own independent tax adviser.
This report may provide addresses of, or contain hyperlinks to, Internet web sites. Oppenheimer & Co. Inc. has not reviewed the linked Internet web site of any third party and takes no responsibility for the contents thereof. Each such address or hyperlink is provided solely for the recipient's convenience and information, and the content of linked third party web sites is not in any way incorporated into this document. Recipients who choose to access such third-party web sites or follow such hyperlinks do so at their own risk. The S&P 500 Index is an unmanaged value-weighted index of 500 common stocks that is generally considered representative of the U.S. stock market. The S&P 500 index figures do not reflect any fees, expenses or taxes. This research is distributed in the UK and elsewhere throughout Europe, as third party research by Oppenheimer Europe Ltd, which is authorized and regulated by the Financial Conduct Authority (FCA). This research is for information purposes only and is not to be construed as a solicitation or an offer to purchase or sell investments or related financial instruments. This report is for distribution only to persons who are eligible counterparties or professional clients and is exempt from the general restrictions in section 21 of the Financial Services and Markets Act 2000 on the communication of invitations or inducements to engage in investment activity on the grounds that it is being distributed in the UK only to persons of a kind described in Article 19(5) (Investment Professionals) and 49(2) High Net Worth companies, unincorporated associations etc.) of the Financial Services and Markets Act 2000 (Financial Promotion) Order 2005 (as amended). It is not intended to be distributed or passed on, directly or indirectly, to any other class of persons. In particular, this material is not for distribution to, and should not be relied upon by, retail clients, as defined under the rules of the FCA. Neither the FCA’s protection rules nor compensation scheme may be applied. This report or any portion hereof may not be reprinted, sold, or redistributed without the written consent of Oppenheimer & Co. Inc. Copyright © Oppenheimer & Co. Inc. 2015.
