Another Brick in the Wall
By John Stoltzfus,
Chief Investment Strategist
Onward and Upward
We see further upside in 2017 though not in a straight line from here
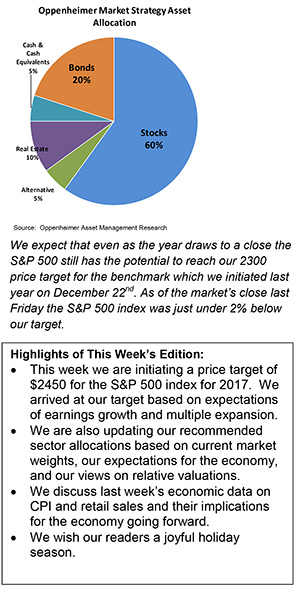
We are initiating a target for the S&P 500 of 2450 for 2017 or some 8.5% above last Friday’s close. Our expectations are for stocks to find further support in the New Year from a continued and further improvement of the current economic expansion stateside along with additional progress that we expect to see in the modest recovery abroad (aided by accommodative monetary policy both domestically and abroad) even as geopolitical and populist headwinds abound..
Our expectations are for tailwinds for the equity market stateside as elements of the stimulative fiscal agenda broadly outlined by President elect Donald Trump are implemented. In our view, this could provide further support for stock prices and some upside risk to our benchmark target.
That said, we believe that the effects of the stimulus agenda are not likely to be felt in the economy until such fiscal policies are enacted and are given some time to take effect.
We expect volatility in the currency markets as interest rates work their way through a process of price discovery relative to the pace of expected growth. These repricing episodes are likely to provide intermittent headwinds for stocks as diverse growth rates among countries and economic regions bump up against currency movements, changing expectations of monetary policy and fiscal policy regimes, which are in transition across the globe.
We arrived at our 2017 price target for the S&P 500 based on our expectations for a combination of earnings growth and multiple expansion as interest rates normalize moderately and investors pay more for each dollar of earnings growth.
We look for the S&P 500 to generate earnings of around $125 per share on which we place a P/E multiple of 19.5x to arrive at a price target of $2,450 for the benchmark in 2017.
Since the surprise outcome of the US Presidential election stocks have broadly rallied across the globe with the US markets leading the process.
As of last Friday the Dow Jones Industrial average, S&P 500, the S&P 400 (mid-caps) and the S&P 600 (small caps) had respectively advanced 12.72%, 9.44%, 18.02% and 23.69% from the start of the year. Just since Election Day the aforementioned indices have risen 8.24%, 5.54%, 10.2% and 15.98%.
Considering the challenges to the market in the first seven weeks of the 2016 or around the Brexit vote in late June, it is not surprising to hear investors ponder how much higher stocks can move before a catalyst appears worthy of a pause or even a pullback.
Just last week a spate of rotation in stocks that included some profit-taking among mid-cap and small-cap stocks saw the S&P 400 and the S&P 600 give back some of their recent gains as they respectively declined 1.49% and 1.8% on the week ending last Friday.
It’s worth noting that the S&P 500 (Large caps), which had lagged the mid and small cap stocks on a year to date basis and from the election day rally’s start, but slipped just 0.06%—signaling to us that last week’s selling was less about fear and more about year-end profit taking and rotation on the back of a year to date and postelection run-up.
Last week we noted that the post-election rally in stocks had seemed to us to have “turned bears into skeptics, skeptics into bulls and bulls into philosophers.” The equity market’s “give back and pause” action of last week saw a respective rightsizing among bears, skeptics, and bulls as they appeared to revert to their traditional stances.
At the core of last week’s action in the bond and stock markets was the Fed’s upward tweak of 25 bps to its Fed Funds range of 0.25-0.50%, slightly higher to a range of 0.50% to 0.75%.
Ironically most investors had expected the Fed to raise its benchmark rate by 0.25 bps at each end of the band range—but instead of rallying on the news investors sold stocks and bonds as they apparently focused on Fed Chair Janet Yellen’s comments intimating that the market might expect three rate hikes in 2017 up from earlier expectations of just two.
From our perch on the radar screen we recall the market “getting into a dither” at the beginning of this year when Fed Vice-Chair Stanley Fisher intimated that the Fed would raise four times in 2016. The Fed instead raised rates just once and was done for 2016 as of last Wednesday.
In the week ahead we look for market activity to slow in pace as the Christmas holiday weekend draws nearer and as denizens of the world’s trading desks head to familial destinations.
We expect that even as the year draws to a close the S&P 500 still has the potential to reach our 2300 price target for the benchmark which we initiated last year on December 22nd. As of the market’s close last Friday the benchmark was just under 2% below our target.
For the complete report, please contact your Oppenheimer Financial Advisor.
Other Disclosures
This report is issued and approved by Oppenheimer & Co. Inc., a member of all Principal Exchanges, and SIPC. This report is distributed by Oppenheimer & Co. Inc., for informational purposes only, to its institutional and retail investor clients. This report does not constitute an offer or solicitation to buy or sell any securities discussed herein in any jurisdiction where such offer or solicitation would be prohibited. The securities mentioned in this report may not be suitable for all types of investors. This report does not take into account the investment objectives, financial situation or specific needs of any particular client of Oppenheimer & Co. Inc. Recipients should consider this report as only a single factor in making an investment decision and should not rely solely on investment recommendations contained herein, if any, as a substitution for the exercise of independent judgment of the merits and risks of investments. The strategist writing this report is not a person or company with actual, implied or apparent authority to act on behalf of any issuer mentioned in the report. Before making an investment decision with respect to any security discussed in this report, the recipient should consider whether such investment is appropriate given the recipient's particular investment needs, objectives and financial circumstances. We recommend that investors independently evaluate particular investments and strategies, and encourage investors to seek the advice of a financial advisor. Oppenheimer & Co. Inc. will not treat non-client recipients as its clients solely by virtue of their receiving this report. Past performance is not a guarantee of future results, and no representation or warranty, express or implied, is made regarding future performance of any security mentioned in this report. The price of the securities mentioned in this report and the income they produce may fluctuate and/or be adversely affected by exchange rates, and investors may realize losses on investments in such securities, including the loss of investment principal.
Oppenheimer & Co. Inc. accepts no liability for any loss arising from the use of information contained in this report. All information, opinions and statistical data contained in this report were obtained or derived from public sources believed to be reliable, but Oppenheimer & Co. Inc. does not represent that any such information, opinion or statistical data is accurate or complete and they should not be relied upon as such. All estimates and opinions expressed herein constitute judgments as of the date of this report and are subject to change without notice. Nothing in this report constitutes legal, accounting or tax advice. Since the levels and bases of taxation can change, any reference in this report to the impact of taxation
INVESTMENT STRATEGY
should not be construed as offering tax advice on the tax consequences of investments. As with any investment having potential tax implications, clients should consult with their own independent tax adviser.
This report may provide addresses of, or contain hyperlinks to, Internet web sites. Oppenheimer & Co. Inc. has not reviewed the linked Internet web site of any third party and takes no responsibility for the contents thereof. Each such address or hyperlink is provided solely for the recipient's convenience and information, and the content of linked third party web sites is not in any way incorporated into this document. Recipients who choose to access such third-party web sites or follow such hyperlinks do so at their own risk. The S&P 500 Index is an unmanaged value-weighted index of 500 common stocks that is generally considered representative of the U.S. stock market. The S&P 500 index figures do not reflect any fees, expenses or taxes. This research is distributed in the UK and elsewhere throughout Europe, as third party research by Oppenheimer Europe Ltd, which is authorized and regulated by the Financial Conduct Authority (FCA). This research is for information purposes only and is not to be construed as a solicitation or an offer to purchase or sell investments or related financial instruments. This report is for distribution only to persons who are eligible counterparties or professional clients and is exempt from the general restrictions in section 21 of the Financial Services and Markets Act 2000 on the communication of invitations or inducements to engage in investment activity on the grounds that it is being distributed in the UK only to persons of a kind described in Article 19(5) (Investment Professionals) and 49(2) High Net Worth companies, unincorporated associations etc.) of the Financial Services and Markets Act 2000 (Financial Promotion) Order 2005 (as amended). It is not intended to be distributed or passed on, directly or indirectly, to any other class of persons. In particular, this material is not for distribution to, and should not be relied upon by, retail clients, as defined under the rules of the FCA. Neither the FCA’s protection rules nor compensation scheme may be applied. This report or any portion hereof may not be reprinted, sold, or redistributed without the written consent of Oppenheimer & Co. Inc. Copyright © Oppenheimer & Co. Inc. 2015.
