Everyday, Everyday I Have the Blues
By John Stoltzfus,
Chief Investment Strategist
Too Much Information
A confluence of factors appeared to overwhelm stocks last week, creating opportunity for those with conviction

This week finds investors around the world pondering if US equity markets will pursue the rally mode they found last Friday or continue down a negative path of price discovery on worries surrounding the US Federal Reserve’s process of normalization (too slow? too fast?), the ongoing trade hostilities between the US and China along with a host of other concerns ranging from the effects of populism on elections and monetary policy abroad to concerns about the outcome of the Q3 earnings season now under way stateside.
The Dow Jones Industrials, S&P 500, the S&P 400 (mid-caps), the Russell 2000 (small caps) and the NASDAQ Composite (over 40% weighted in technology and tech related stocks) respectively fell last week: 4.2%, 4.1%, 4.9%, 5.2% and 3.7%.
A rally on Friday provided some relief for frazzled investors as the Dow Jones Industrials, the S&P 500, the S&P 400, the Russell 2000 and the NASDAQ Composite respectively added: 1.2%, 1.4%. 0.24%, 0.08% and 2.3% on the day.
International equity benchmarks suffered for most of last week as well with the MSCI EAFE index (Developed Markets ex-US and Canada), the MSCI Emerging Markets and the MSCI Frontier Markets respectively sliding 3.9%, 2.1% and 1.7% on the week.
Friday saw rallies in a number of regions around the world outside of the US which saw MSCI EAFE close near flat while the MSCI Emerging Markets and the MSCI Frontier Markets respectively advanced 2.7% and 1.2% on the day.
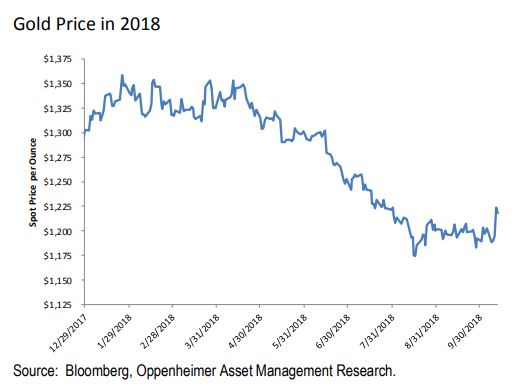
Gold caught a bid
Turmoil in equity markets sent at least some investors into gold last week, driving prices higher by 1.3% and producing the shiny metal’s biggest gain since 2016 last Thursday after having posted six straight monthly losses this year (see figure below).
The question for gold bugs is for how long can gold stay strong with the Federal Reserve committed to normalizing interest rates in the US as well as a normalization process—albeit still relatively nascent—about to begin outside the US (Europe, Japan and elsewhere around the globe).
“Should Friday’s upward swing persist over the course of the next few days it could restore investors’ confidence and result in what has come to be known as yet another “buy the dip” opportunity.”
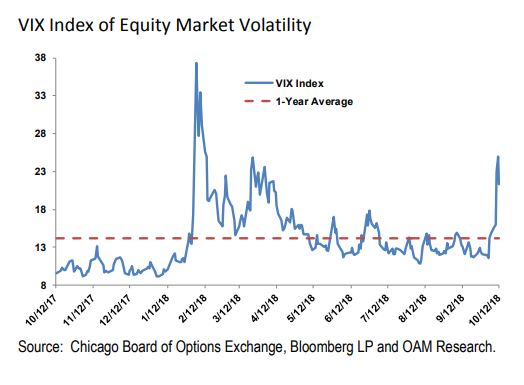
Last week’s jump in the price of gold appeared to occur in response to a drop in the yield of the 10-year Treasury last week (from 3.23% to 3.16%) reflecting in some part a surge in volatility in the stock market. The VIX (a gauge of volatility as it relates to the S&P 500) jumped from a level of 14.82 at the start of the week to a level of just under 25 on Thursday before it eased somewhat to a level of 21.3 on Friday as stocks rallied (see figure below).
Investors likely will be watching gold to see if it can follow through into this week to find the strength it found in the middle of last week.
In our view the direction of the yield on the 10-year Treasury could provide a clue as to how gold’s price moves in the near term. Even with last week’s rally at Friday’s close the price of gold was down 6.5% from where it began the year.
Oil Prices Retreat after Strong Run This Year
Oil prices fell over 4% last week as a decline in stock prices along with more worries about the risk of a protracted trade war with China and cuts in global growth estimates from the International Monetary Fund cooled investor sentiment for the black gold with West Texas Intermediate oil falling from $74.34 bbl. at the start of the week to a closing price on Friday of $71.34 bbl.
That said, last week’s drop in the price of oil didn’t put much of a dent into the performance of the commodity as WTI remains up some 19.6% from the start of 2018 through last Friday.
Last Week’s Game of Musical Chairs
We might describe the last few days in the market as a week of nasty musical chairs played with diverse asset classes and driven by machine selling powered by bearish quantitative analytics.
Technical factors appeared overall to outweigh fundamentals, which in our view remained pretty much intact and in fact became more attractive as valuation multiples declined. (See page 5 of this report for more detail on the effect of last week’s market action on forward price to earnings multiples).
A confluence of diverse and troublesome factors took markets lower last week. Among the factors we sighted that served to drag the market and raise concerns among investors, traders and observers were:
By Friday it appeared that the market downturn had run its course and a rally ensued. Should Friday’s upward swing persist over the course of the next few days (give or take some testing) it could restore investors’ confidence and result in what has come to be known as yet another “buy the dip” opportunity in a long series of the same since the markets began their recovery in March of 2009.
From our perch on the Market Radar Screen, Friday’s move to the upside revealed the persistent resilience of the market, the power of positive earnings surprises and evidence that bullish conviction prevails to large extent supported by economic and corporate fundamentals even as a myriad of challenges remain on the landscape.
Downside action this week looked to us less like the 2011 selloff cited by a number of observers over the course of last week and instead more like the equity market downdraft we saw in August 2015 and again in January 2016 when the markets stateside and worldwide reacted to two successive devaluations by China of its currency.
This year’s decline of the yuan (around 6%) likely played a part in creating the sensitivity that the markets felt before becoming overwhelmed by the confluence of aforementioned factors that fed last week’s volatility and move to the downside.
Curiously enough taken in context the market’s rally on Friday may in no small part signal that the yuan’s most recent decline is less to worry about than when considered at first glance. In fact we’d argue that it’s been similar to the yuan’s declines in 2015 and 2016, each of which proved less troublesome to the US economy and markets than what was initially expected.
For now we continue to believe that if investors know what they own in their portfolios, know why they own it and have an idea how what they own might be expected to perform under different economic and market conditions, they will be better positioned to navigate periods of volatility like last week’s.
As a result, they should be in good shape to judge the risk and opportunities that emerge on the investment landscape as they look for “the babies that got thrown out with the bath water.” Carpe Diem.
For the complete report, please contact your Oppenheimer Financial Advisor.
Other Disclosures
This report is issued and approved by Oppenheimer & Co. Inc., a member of all Principal Exchanges, and SIPC. This report is distributed by Oppenheimer & Co. Inc., for informational purposes only, to its institutional and retail investor clients. This report does not constitute an offer or solicitation to buy or sell any securities discussed herein in any jurisdiction where such offer or solicitation would be prohibited. The securities mentioned in this report may not be suitable for all types of investors. This report does not take into account the investment objectives, financial situation or specific needs of any particular client of Oppenheimer & Co. Inc. Recipients should consider this report as only a single factor in making an investment decision and should not rely solely on investment recommendations contained herein, if any, as a substitution for the exercise of independent judgment of the merits and risks of investments. The strategist writing this report is not a person or company with actual, implied or apparent authority to act on behalf of any issuer mentioned in the report. Before making an investment decision with respect to any security discussed in this report, the recipient should consider whether such investment is appropriate given the recipient's particular investment needs, objectives and financial circumstances. We recommend that investors independently evaluate particular investments and strategies, and encourage investors to seek the advice of a financial advisor. Oppenheimer & Co. Inc. will not treat non-client recipients as its clients solely by virtue of their receiving this report. Past performance is not a guarantee of future results, and no representation or warranty, express or implied, is made regarding future performance of any security mentioned in this report. The price of the securities mentioned in this report and the income they produce may fluctuate and/or be adversely affected by exchange rates, and investors may realize losses on investments in such securities, including the loss of investment principal.
Oppenheimer & Co. Inc. accepts no liability for any loss arising from the use of information contained in this report. All information, opinions and statistical data contained in this report were obtained or derived from public sources believed to be reliable, but Oppenheimer & Co. Inc. does not represent that any such information, opinion or statistical data is accurate or complete and they should not be relied upon as such. All estimates and opinions expressed herein constitute judgments as of the date of this report and are subject to change without notice. Nothing in this report constitutes legal, accounting or tax advice. Since the levels and bases of taxation can change, any reference in this report to the impact of taxation
INVESTMENT STRATEGY
should not be construed as offering tax advice on the tax consequences of investments. As with any investment having potential tax implications, clients should consult with their own independent tax adviser.
This report may provide addresses of, or contain hyperlinks to, Internet web sites. Oppenheimer & Co. Inc. has not reviewed the linked Internet web site of any third party and takes no responsibility for the contents thereof. Each such address or hyperlink is provided solely for the recipient's convenience and information, and the content of linked third party web sites is not in any way incorporated into this document. Recipients who choose to access such third-party web sites or follow such hyperlinks do so at their own risk. The S&P 500 Index is an unmanaged value-weighted index of 500 common stocks that is generally considered representative of the U.S. stock market. The S&P 500 index figures do not reflect any fees, expenses or taxes. This research is distributed in the UK and elsewhere throughout Europe, as third party research by Oppenheimer Europe Ltd, which is authorized and regulated by the Financial Conduct Authority (FCA). This research is for information purposes only and is not to be construed as a solicitation or an offer to purchase or sell investments or related financial instruments. This report is for distribution only to persons who are eligible counterparties or professional clients and is exempt from the general restrictions in section 21 of the Financial Services and Markets Act 2000 on the communication of invitations or inducements to engage in investment activity on the grounds that it is being distributed in the UK only to persons of a kind described in Article 19(5) (Investment Professionals) and 49(2) High Net Worth companies, unincorporated associations etc.) of the Financial Services and Markets Act 2000 (Financial Promotion) Order 2005 (as amended). It is not intended to be distributed or passed on, directly or indirectly, to any other class of persons. In particular, this material is not for distribution to, and should not be relied upon by, retail clients, as defined under the rules of the FCA. Neither the FCA’s protection rules nor compensation scheme may be applied. This report or any portion hereof may not be reprinted, sold, or redistributed without the written consent of Oppenheimer & Co. Inc. Copyright © Oppenheimer & Co. Inc. 2015.