Everyday, Everyday I Have the Blues
By John Stoltzfus,
Chief Investment Strategist
Keep on Truckin’
A near-term lull in economic indicators likely more noise than signal

The S&P 500 index closed above our 2017 price target of 2450 last week on June 19. As a result, we are in the process of considering an adjustment to our 2017 price target and earnings estimates for the rest of the year. We had initiated our price target for this year and our earnings projection of around $125 per share (on which we placed a P/E multiple of 19.5x) last December.
The broad market’s upward trajectory thus far this year in our opinion has come as a result of a number of factors including:
Looking ahead to second quarter earnings season, FactSet data indicates that analysts have cut their projections from earlier this year and as of last week forecast earnings growth of around 6.6% for the current quarter (Q2). Nine of the benchmark’s sectors are expected to show positive growth led by the Energy, Information Technology, and Financials sectors.
“The price of oil could find support in the weeks ahead should economic data stateside and abroad point to an acceleration in global economic growth ahead.”
Our expectation is that the recent lowering of analyst expectations ahead of the reporting season that lies ahead may provide yet another season of positive surprises once results actually get under way.
The US economy, while showing some weakness in some of the economic data that has crossed the transom of late, continues in an apparent sustainable expansion while international economies around the world show increased improvements in a process of economic recovery.
US multinationals likely received a boost from the effects of the dollar’s weakness since the beginning of the year versus the currencies of many of the nation’s trading partners in the developed and emerging economies. As of last Friday Bloomberg data showed the dollar year to date down against all ten of the G10 developed nation currencies and lower against 17 emerging market currencies. The dollar’s weakness so far this year could reflect positively on US corporate results from operations abroad.
Until Q2 earnings season gets well under way, the market could come under pressure near term as sector rotation and rebalancing ahead of the close of the second quarter take place. We suggest investors stay focused and practice patience should we see a near-term pick-up in volatility.
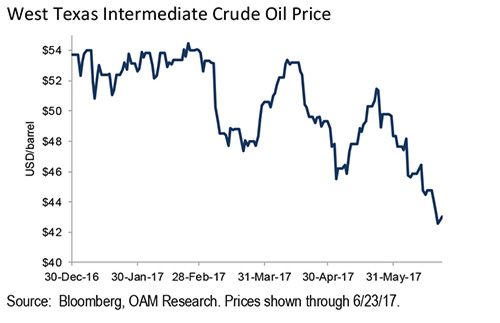
Oil’s slippery slope in perspective
The decline in the price of oil since it hit its high for the year in February has pushed the commodity’s price into bear market territory. The price of West Texas Intermediate crude fell just under 4% last week. It has fallen over 21% from its high on February 23rd of this year and as of Friday stood 19.9% off from the beginning of the year (see figure below).
Even as OPEC has labored to keep oil prices from falling, the effects of lack of compliance by a few of its members along with 23 straight weeks of increases in the Baker Hughes rig count stateside have served to undercut its efforts.
The decline in the price of oil has raised concern among some observers who suggest oil’s decline in price may be signaling economic weakness ahead.
However, from our perspective, we see the decline of the price of oil as more illustrative of a glut in supply caused by advanced technologies that have improved the process and efficiencies in discovery, drilling and recovery of the commodity while at the same time business and consumers become more efficient in its use and application via improvements in manufacturing equipment, automobiles, trucks, locomotives, air planes, facilities, housing and home appliances. In addition advancements in alternative fuels continue to gain competitive ground against the incumbent.
In our opinion the current decline in the price of oil may as well reflect its having become overbought as a result of the momentum which had accompanied the significant surge it experienced from a low of $26.21 in February 2016. Even with its recent decline the price of WTI as of last Friday stood some 64% above its 2016 low.
The price of oil could find support in the weeks ahead should economic data stateside and abroad point to an acceleration in global economic growth ahead. For now we reiterate our underweight recommendation on the sector that we’ve held since December 2016.
Information Technology regains some lost ground
The S&P 500’s Information Technology sector has regained around half the ground it lost when it fell just under 4% from its 2017 peak reached on June 8th. The sector stood just 1.7% off its peak as of last Friday’s close. A combination of improved sentiment about prospects for the sector from a cyclical perspective as well as in some part from the excitement and surprise around Amazon’s plans to acquire Whole Foods has served to lift the group.
Biotech looks to be on path to recovery
Last week saw a sizeable jump in Biotechnology as investors moved funds back into the segment on the back of signs that the administration might not take as hard a line on pricing as investors had earlier feared. The i-Shares Biotech ETF (IBB) surged over 9.5% last week. The ETF has risen some 32.6% from its low one year ago as investors seeking growth tied to intermediate and long-term trends in health care return to the stocks. The i-Shares Biotech ETF (IBB) remained 19.6% off its July 2015 high as of last Friday. That should help remind investors that stocks don’t always move up or down in a straight line and that patience is a virtue.
In the week ahead a large packet of economic data ranging from durable goods, home prices, consumer confidence, manufacturing, GDP, and consumer sentiment will compete for investors’ attention while a number of Fed officials including Chair Janet Yellen speak at events around the country.
Even as the summer weather beckons traders, investors and observers to vacation days that may lie ahead, the action around the market warrants increased attention.
For the complete report, please contact your Oppenheimer Financial Advisor.
Other Disclosures
This report is issued and approved by Oppenheimer & Co. Inc., a member of all Principal Exchanges, and SIPC. This report is distributed by Oppenheimer & Co. Inc., for informational purposes only, to its institutional and retail investor clients. This report does not constitute an offer or solicitation to buy or sell any securities discussed herein in any jurisdiction where such offer or solicitation would be prohibited. The securities mentioned in this report may not be suitable for all types of investors. This report does not take into account the investment objectives, financial situation or specific needs of any particular client of Oppenheimer & Co. Inc. Recipients should consider this report as only a single factor in making an investment decision and should not rely solely on investment recommendations contained herein, if any, as a substitution for the exercise of independent judgment of the merits and risks of investments. The strategist writing this report is not a person or company with actual, implied or apparent authority to act on behalf of any issuer mentioned in the report. Before making an investment decision with respect to any security discussed in this report, the recipient should consider whether such investment is appropriate given the recipient's particular investment needs, objectives and financial circumstances. We recommend that investors independently evaluate particular investments and strategies, and encourage investors to seek the advice of a financial advisor. Oppenheimer & Co. Inc. will not treat non-client recipients as its clients solely by virtue of their receiving this report. Past performance is not a guarantee of future results, and no representation or warranty, express or implied, is made regarding future performance of any security mentioned in this report. The price of the securities mentioned in this report and the income they produce may fluctuate and/or be adversely affected by exchange rates, and investors may realize losses on investments in such securities, including the loss of investment principal.
Oppenheimer & Co. Inc. accepts no liability for any loss arising from the use of information contained in this report. All information, opinions and statistical data contained in this report were obtained or derived from public sources believed to be reliable, but Oppenheimer & Co. Inc. does not represent that any such information, opinion or statistical data is accurate or complete and they should not be relied upon as such. All estimates and opinions expressed herein constitute judgments as of the date of this report and are subject to change without notice. Nothing in this report constitutes legal, accounting or tax advice. Since the levels and bases of taxation can change, any reference in this report to the impact of taxation
INVESTMENT STRATEGY
should not be construed as offering tax advice on the tax consequences of investments. As with any investment having potential tax implications, clients should consult with their own independent tax adviser.
This report may provide addresses of, or contain hyperlinks to, Internet web sites. Oppenheimer & Co. Inc. has not reviewed the linked Internet web site of any third party and takes no responsibility for the contents thereof. Each such address or hyperlink is provided solely for the recipient's convenience and information, and the content of linked third party web sites is not in any way incorporated into this document. Recipients who choose to access such third-party web sites or follow such hyperlinks do so at their own risk. The S&P 500 Index is an unmanaged value-weighted index of 500 common stocks that is generally considered representative of the U.S. stock market. The S&P 500 index figures do not reflect any fees, expenses or taxes. This research is distributed in the UK and elsewhere throughout Europe, as third party research by Oppenheimer Europe Ltd, which is authorized and regulated by the Financial Conduct Authority (FCA). This research is for information purposes only and is not to be construed as a solicitation or an offer to purchase or sell investments or related financial instruments. This report is for distribution only to persons who are eligible counterparties or professional clients and is exempt from the general restrictions in section 21 of the Financial Services and Markets Act 2000 on the communication of invitations or inducements to engage in investment activity on the grounds that it is being distributed in the UK only to persons of a kind described in Article 19(5) (Investment Professionals) and 49(2) High Net Worth companies, unincorporated associations etc.) of the Financial Services and Markets Act 2000 (Financial Promotion) Order 2005 (as amended). It is not intended to be distributed or passed on, directly or indirectly, to any other class of persons. In particular, this material is not for distribution to, and should not be relied upon by, retail clients, as defined under the rules of the FCA. Neither the FCA’s protection rules nor compensation scheme may be applied. This report or any portion hereof may not be reprinted, sold, or redistributed without the written consent of Oppenheimer & Co. Inc. Copyright © Oppenheimer & Co. Inc. 2015.
