Shifting Tides: Correlations and Multi-Asset Investing
By Gaal Surugeon, Jeffrey Sutton and Michael Chan
"Lower correlations—coupled with greater dispersion of volatility across sectors—emphasize the importance of asset allocation and could lead to more opportunities for outperformance by active managers over passive beta strategies."
Key Takeaways
- Historically, the lowest levels of cross-asset correlation have coincided with periods of higher equity multiples and government bond yields—a path the U.S. markets have been traveling on.
- Correlation among asset classes has been declining in recent years, which should help active management prevail over passive beta.
- Diversification across sectors, asset classes and geographic regions remains a key tenet of investing, one that must be maintained throughout a full market cycle to reap the benefits.
It‘s no surprise that generating alpha through asset allocation has been challenging in the aftermath of the financial crisis. Global central banks’ manipulation of risk assets is believed to have distorted market correlations through the seemingly endless loop of risk-on, risk-off sentiment. In fact, the post-2008 era has seen the highest levels of correlation in the past 20 years.
However, the tides appear to be shifting as cross-asset correlations1 have been receding in recent months. Cross-asset correlation is defined as how closely returns of different assets move relative to one another (U.S. equity vs. U.S. credit; global sovereign debt vs. real assets). There are three primary observations we draw from this trend: 1) correlations are typically lowest in mature stages of the market cycle; 2) asset-allocation strategies stand to benefit from declining correlations; and 3) active management should prevail over passive beta. These observations re-emphasize the continued importance of maintaining a well-diversified portfolio throughout a full market cycle.
“As shifts in monetary and fiscal policy begin to take hold, we expect the pace of market-cycle maturation to accelerate.”
Correlations Are Lowest in Mature Stages of the Market Cycle
Historically, the lowest levels of cross-asset correlation have coincided with periods of higher equity multiples and government bond yields. This environment is typical of the “inflationary boom” scenario defined by accelerating growth and rising inflation. While we may still be far from the warning track, we believe the United States is on a path toward higher interest rates and extended multiples. As shifts in monetary and fiscal policy begin to take hold, we expect the pace of market-cycle maturation to accelerate.
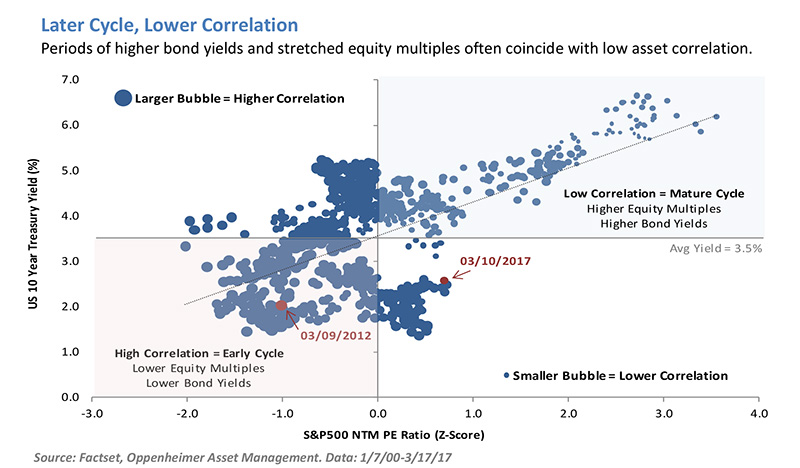
The above chart illustrates the historical relationship between correlations and the market cycle. The chart plots weekly 10-Year Treasury yields against S&P 500 forward P/E ratios (z-score) since 2000. The size of the blue dots represents the level of cross-asset correlation on that week, whereby the larger dots indicate a higher correlation. There appears to be a clear trend across the three metrics—periods of higher bond yields and richly valued equity multiples often coincide with low asset correlation. On the other hand, an early-cycle environment—defined by low bond yields and low equity valuations—tends to breed higher correlations as beta and sentiment converge. Therefore, if history is any indication, then global asset classes should begin to separate from each other and offer improved risk diversification as we move from the bottom-left to the top-right quadrant in the market cycle.
![]()
Disclaimer
Sources: Factset, Bloomberg Financial Services, Zephyr StyleAdvisor, Morningstar Inc.
The returns for the simulated portfolios represent performance of hypothetical allocations and do not represent results of actual accounts. The performance of actual accounts will vary. Performance results for hypothetical allocations have inherent limitations. Such returns do not factor in the effects of economic and market conditions then in existence on the investment manager’s decision-making process if the manager were actually managing client money which would have changed the allocation and results. Additionally, hypothetical allocations are subject to the fact that they were determined with the benefit of hindsight based on the actual performance of the individual manager or index.
Definitions
Indices are unmanaged and presented for comparison purposes only. Please note that the returns displayed for indices do not take into account any of the costs associated with buying and selling individual securities. Individuals cannot invest directly in an index.
Bloomberg Barclays US Aggregate Index (Treasury, Agency, Securitized – MBS, Credit – Corporate). The Bloomberg Barclays US Aggregate Bond Index is a broad-based flagship benchmark that measures the investment grade, US dollar-denominated, fixed-rate taxable bond market. The index includes Treasuries, government-related and corporate securities, MBS (agency fixed-rate and hybrid ARM pass-through), ABS and CMBS (agency and non-agency).
Bloomberg Commodity Index - The Index tracks prices of futures contracts on physical commodities on the commodity markets. The index is designed to minimize concentration in any one commodity or sector. It currently has 22 commodity futures in seven sectors.
BofA ML High-Yield Master Index - a capitalization-weighted Index that provides a broad measure of the performance of the non-investment grade US domestic bond market. The Index is limited to US domestic and Yankee markets. Bonds must have greater than 1 year remaining to final maturity, at least $100 million face outstanding, be US dollar pay, have a fixed coupon schedule with a credit rating below investment grade not in default.
Citigroup Non-USD World Government Bond Index (WGBI) – The Citigroup Non-U.S. Dollar World Government Bond Index is an unmanaged, market-capitalization-weighted index that tracks 10 government bond indices, excluding the United States
FTSE NAREIT All REITs Index – is a market capitalization-weighted index that and includes all tax-qualified real estate investment trusts (REITs) that are listed on the New York Stock Exchange, the American Stock Exchange or the NASDAQ National Market List. The FTSE NAREIT All REITs Index is not free float adjusted, and constituents are not required to meet minimum size and liquidity criteria.
MSCI World ex-USA - The MSCI World ex USA Index captures large and mid-cap representation across 22 of 23 Developed Markets (DM) countries excluding the United States.
MSCI Emerging Markets - The MSCI Emerging Markets Index is an index created by Morgan Stanley Capital International (MSCI) designed to measure equity market performance in global emerging markets.
Russell 1000 Index – a stock market index that represents the highest-ranking 1,000 stocks in the Russell 3000 Index, which represents about 90% of the total market capitalization of that index.
Russell 2000 Index - The Russell 2000 index is an index measuring the performance approximately 2,000 small-cap companies in the Russell 3000 Index, which is made up of 3,000 of the biggest U.S. stocks. The Russell 2000 serves as a benchmark for small-cap stocks in the United States.
Risks
Investing in securities is speculative and entails risk. There can be no assurance that the investment objectives will be achieved or that an investment strategy will be successful. The use of leverage, short sales and derivative transactions, investment in foreign or illiquid securities, and potentially limited diversification, could cause significant losses.
Special Risks of Real Estate Securities
Real estate investing may be subject to a higher degree of market risk because of concentration in a specific industry, sector or geographical sector. Real estate investing may be subject to risks including, but not limited to, declines in the value of real estate, risks related to general and economic conditions, changes in the value of the underlying property owned by the trust and defaults by borrower.
As with any investment, there are risks associated with investing in bonds. These include risks related to interest rate movements (interest rate risk and reinvestment risk), and the risk of credit quality deterioration (credit or default risk). These risks need to be evaluated and effectively managed if the client is to achieve the potential benefits of investing in fixed income securities.
Interest Rate Risk. Interest rate risk is the risk that market interest rate fluctuations result in a decline in the security’s price between the time the investor buys it and the time (before maturity) at which he or she sells it. (The bond’s price will decline when rates rise and vice versa.)
Reinvestment Risk. Reinvestment risk is the risk that the cash flow received from a bond may be reinvested at a lower rate of return. Short-maturity bonds and callable bonds are the instruments most frequently associated with reinvestment risk. Callable bonds may subject the investor to reinvestment risk. Such bonds allow the issuer to repay the principal (with accrued issuer the flexibility to refinance the debt if rates are low or declining. The timing of bond calls occurs precisely when investors do not want to receive their principal back, i.e., when they can only reinvest at either lower rates or in lower-quality securities. To compensate them for this reinvestment risk, investors in callables typically demand (and get) a higher interest rate as compared to non-callables.
Credit or Default Risk. Credit or default risk is the risk that the issuer may be unable to make timely principal and interest payments on the bond. It is the critical determinant of a fixed income security’s quality.
High Yield Fixed Income Risk. High yield fixed income securities are considered to be speculative and involve a substantial risk of default. Adverse changes in economic conditions or developments regarding the issuer are more likely to cause price volatility for issuers of high yield debt than would be the case for issuers of higher grade debt securities. In addition, the market for high yield debt may be less attractive than that of higher-grade debt securities.
Past performance does not guarantee future results.
© 2017 All rights reserved. This report is intended for informational purposes only. All information provided and opinions expressed are subject to change without notice. The information and statistical data contained herein have been obtained from sources we believe to be reliable. No part of this report may be reproduced in any manner without the written permission of Oppenheimer Asset Management or any of its affiliates. Any securities discussed should not be construed as a recommendation to buy or sell and there is no guarantee that these securities will be held for a client’s account nor should it be assumed that they were or will be profitable. The Consulting Group is a division of Oppenheimer Asset Management. Oppenheimer Asset Management is the name by which Oppenheimer Asset Management Inc. ("OAM") does business. OAM is an indirect, wholly owned subsidiary of Oppenheimer Holdings Inc., which is also the indirect parent of Oppenheimer & Co. Inc. ("Oppenheimer"). Oppenheimer is a registered investment adviser and broker dealer. Securities are offered through Oppenheimer. OAM04062017SS1