Everyday, Everyday I Have the Blues
By John Stoltzfus,
Chief Investment Strategist
Keep Your Eyes on the Road and Your Hands upon the Wheel
Patience, commitment and focus likely will continue to be rewarded
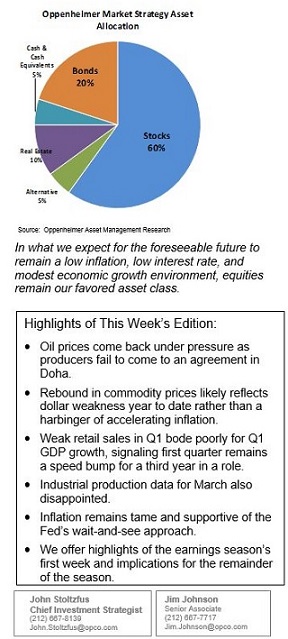
The recent rebound in oil prices that sent the price of West Texas Intermediate oil up over 53% from a low of $26.21 on February 11th to a close of $40.36 last Friday may be challenged near term by a failure of foreign oil producers over the weekend to arrive at a formal agreement to limit production.
News indicating that talks in Doha between OPEC members and other foreign producers of oil had failed to arrive at an agreement to freeze output raised concern in oil markets on Sunday as we went to press.
For all the immediacy of breaking news and the potential to see oil prices give back some of their recent gains, we believe any near-term drama tied to the price of the “black gold” should serve as a reminder to investors that the fundamentals underlying the price of this key commodity have likely been irrevocably changed by technological advances and the process of globalization. We’d further posit that both of these are “genies” not likely to ever return to their respective “bottles,” notwithstanding near-term efforts by producers of oil sovereign or corporate to control the price or flow of oil.
Ironically over the last few days concerns had begun to rise that a whiff of inflation might arrive on the economic landscape after the price of oil and other commodities had jumped respectively from lows in February. (Indeed, the March CPI data, however, tell a different story – see pages 6-7.)
A glance at the performance of the CRB Commodities index, which tracks prices of a basket of 19 diverse commodities, advanced as much as 14.6% from a low on February 11th through March 17th and as of last Friday was some 12.02% above its low in February.
From our perspective on the radar screen, the recent respective rallies of 17 of the 19 commodities represented in the CRB index reflect more of just how oversold the commodity complex had become by February 11th, rather than an indication that inflation might near term become an issue of concern for central bankers.
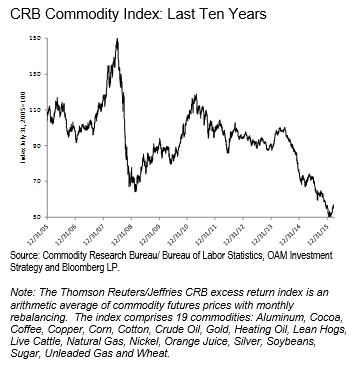
In our view, the recent rally within the commodity complex appears to be a combination of factors that includes the effect of the US dollar’s recent decline (against a broad array of G-10 and emerging market currencies) on dollar-priced commodities; some stockpiling by foreign purchasers of dollar-priced commodities as a result; as well as continuing evidence of the sustainability of the US economic expansion as well as signs that economic recovery abroad continues, albeit aided by foreign central bank efforts.
We believe that as a process of economic normalization supported by central banks vigilant against deflationary trends gains traction, investors will need to avoid mistaking reflation for worrisome inflation.
In what we expect for the foreseeable future to remain a low inflation, low interest rate, and modest economic growth environment, equities remain our favored asset class. We expect investors will opt for barbell strategies that utilize a mix of some growth stocks and value stocks.
As a low interest rate environment moves toward an eight-year anniversary, we expect dividend-paying stocks to increasingly gain favor with investors. We suggest a mix of cyclical as well as defensive dividend-paying stocks with an emphasis on cyclicals in an environment where central bank efforts remain committed to providing support for economic growth and wary of disinflationary trends stateside and deflationary risk outside of the US.
(See pages 3 and 11 for more detail on our recommended investment stance and suggested allocations.)
Earnings Season: Too early to tell overall but we’d say, “so far so good”
FactSet shows that with 7% of companies in the S&P 500 having reported results through last week for Q1 2016, 71% have reported earnings that beat the mean estimate and 60% have reported sales that were better than the mean estimate.
For Q1 2016, the blended earnings decline stands at -9.3%. The blended sales decline for the S&P 500 for Q3 2015 is -1.3%. The blended results include the actual results thus far reported and average analyst estimates for companies yet to report.
If the index reports a decline in earnings for Q1, it will mark the first time the index has seen four consecutive quarters of year-over-year declines in earnings since the Great Recession (Q4 2008 through Q3 2009).
While the US dollar has declined against a number of developed and emerging market currencies year to date, the arrival of that trend so far appears too late to have had a positive impact on first- quarter results.
FactSet data also show that of the 26 companies in the S&P 500 that had reported results for Q1 through last Wednesday, 19 cited some negative effect on earnings or sales (revenues) in the first quarter (or for the remainder of the year) due to the strength of the dollar, which persisted through most of the period.
For companies that generate more than 50% of sales inside the US, FactSet shows the blended earnings decline at -3.5%. For companies that generate less than 50% of their sales inside the US, the blended earnings decline is -18.9%.
For companies that generate more than 50% of salesinside the US, the blended sales growth rate is +3.0%. For companies that generate less than 50% of sales inside the US, the blended sales decline is -11.5%.
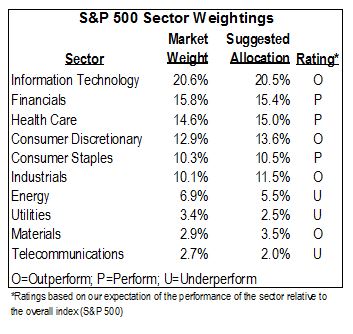
For Q1, the Energy sector is expected to be the largest contributor to the year-over-year declines in both earnings and revenues for the S&P 500.
The blended earnings decline for the S&P 500 (ex-Energy) for Q1 2016 is -4.2%. The blended sales growth rate for the S&P 500 (ex-Energy) for Q1 2016 is +1.6%.
Seven sectors for Q1 are expected to report a year-over-year decline in earnings, led by the Energy and Materials sectors.
Three sectors are expected to report year-over-year earnings growth, including the Telecom Services, Consumer Discretionary and Healthcare.
Five sectors are projected to report year-over-year growth in revenues, led by the Telecom services and Health Care sectors. Five sectors are predicted to report a year-over-year decline in revenues, led by the Energy and Materials sectors.
We expect that for yet another quarter, analyst cuts to expectations ahead of earnings season will provide opportunity for upside surprises throughout the season.
The weaker dollar should contribute positively to US multinational revenues and earnings in the quarters ahead. The market as a discount mechanism appears to us to already sense better things ahead.
Stay tuned.
For the complete report, please contact your Oppenheimer Financial Advisor.
Potential Conflicts of Interest
Strategic analysts employed by Oppenheimer & Co. Inc. are compensated from revenues generated by the firm. Oppenheimer & Co. Inc. generally prohibits strategists and members of his or her households from executing trades in the securities of a company that is discussed in a strategy report. . Recipients of this report are advised that any or all of the foregoing as well as more specific disclosures set forth below, may at times give rise to potential conflicts of interest.
Other Disclosures
This report is issued and approved by Oppenheimer & Co. Inc., a member of all Principal Exchanges, and SIPC. This report is distributed by Oppenheimer & Co. Inc., for informational purposes only, to its institutional and retail investor clients. This report does not constitute an offer or solicitation to buy or sell any securities discussed herein in any jurisdiction where such offer or solicitation would be prohibited. The securities mentioned in this report may not be suitable for all types of investors. This report does not take into account the investment objectives, financial situation or specific needs of any particular client of Oppenheimer & Co. Inc. Recipients should consider this report as only a single factor in making an investment decision and should not rely solely on investment recommendations contained herein, if any, as a substitution for the exercise of independent judgment of the merits and risks of investments. The strategist writing this report is not a person or company with actual, implied or apparent authority to act on behalf of any issuer mentioned in the report. Before making an investment decision with respect to any security discussed in this report, the recipient should consider whether such investment is appropriate given the recipient's particular investment needs, objectives and financial circumstances. We recommend that investors independently evaluate particular investments and strategies, and encourage investors to seek the advice of a financial advisor. Oppenheimer & Co. Inc. will not treat non-client recipients as its clients solely by virtue of their receiving this report. Past performance is not a guarantee of future results, and no representation or warranty, express or implied, is made regarding future performance of any security mentioned in this report. The price of the securities mentioned in this report and the income they produce may fluctuate and/or be adversely affected by exchange rates, and investors may realize losses on investments in such securities, including the loss of investment principal.
Oppenheimer & Co. Inc. accepts no liability for any loss arising from the use of information contained in this report. All information, opinions and statistical data contained in this report were obtained or derived from public sources believed to be reliable, but Oppenheimer & Co. Inc. does not represent that any such information, opinion or statistical data is accurate or complete and they should not be relied upon as such. All estimates and opinions expressed herein constitute judgments as of the date of this report and are subject to change without notice. Nothing in this report constitutes legal, accounting or tax advice. Since the levels and bases of taxation can change, any reference in this report to the impact of taxation
INVESTMENT STRATEGY
should not be construed as offering tax advice on the tax consequences of investments. As with any investment having potential tax implications, clients should consult with their own independent tax adviser.
This report may provide addresses of, or contain hyperlinks to, Internet web sites. Oppenheimer & Co. Inc. has not reviewed the linked Internet web site of any third party and takes no responsibility for the contents thereof. Each such address or hyperlink is provided solely for the recipient's convenience and information, and the content of linked third party web sites is not in any way incorporated into this document. Recipients who choose to access such third-party web sites or follow such hyperlinks do so at their own risk. The S&P 500 Index is an unmanaged value-weighted index of 500 common stocks that is generally considered representative of the U.S. stock market. The S&P 500 index figures do not reflect any fees, expenses or taxes. This research is distributed in the UK and elsewhere throughout Europe, as third party research by Oppenheimer Europe Ltd, which is authorized and regulated by the Financial Conduct Authority (FCA). This research is for information purposes only and is not to be construed as a solicitation or an offer to purchase or sell investments or related financial instruments. This report is for distribution only to persons who are eligible counterparties or professional clients and is exempt from the general restrictions in section 21 of the Financial Services and Markets Act 2000 on the communication of invitations or inducements to engage in investment activity on the grounds that it is being distributed in the UK only to persons of a kind described in Article 19(5) (Investment Professionals) and 49(2) High Net Worth companies, unincorporated associations etc.) of the Financial Services and Markets Act 2000 (Financial Promotion) Order 2005 (as amended). It is not intended to be distributed or passed on, directly or indirectly, to any other class of persons. In particular, this material is not for distribution to, and should not be relied upon by, retail clients, as defined under the rules of the FCA. Neither the FCA’s protection rules nor compensation scheme may be applied. This report or any portion hereof may not be reprinted, sold, or redistributed without the written consent of Oppenheimer & Co. Inc. Copyright © Oppenheimer & Co. Inc. 2015.
