Everyday, Everyday I Have the Blues
By John Stoltzfus,
Chief Investment Strategist
If You Can’t Have the One You Love…
“Risk on” is followed by “risk off,” driven by a market seeking a catalyst for next move
It’s not as much a Larry David, “Curb Your Enthusiasm” market as it was a few weeks ago but now more of a “worry worry market” that lacks enough conviction to move stocks in any one direction for any amount of time long enough for money managers and traders to sink their teeth into and rack up performance.
It’s a market that for now is prone to flip-flop from positive to negative and even to somewhere in between as would-be catalysts pertaining to wages, elections, and asset class prices work their way through a process of price discovery.
As a result, market machinations persist in trying investors’ and commentators’ patience – a virtuethe exercise of which is not all that well known in the vicinity of the markets as a rule – and leading of late to a rise in negativity and edginess for the near term.
The VIX, a gauge of market volatility (see page 5), jumped 17.3% last week as the S&P 500, the S&P 400 (mid-caps) and the Russell 2000 (small-caps) slipped -1.2%, -1.7% and -1.8% respectively.
From our perch on the market radar screen it looks as if markets are doing about what they should be doing at this juncture: taking a trim (i.e., profit taking), giving back some of the market’s earlier rally, and taking a breather for rotation and repositioning.
To us it seems analogous to drivers and passengers taking a break on a long journey, getting out of the vehicle for a healthy stretch en route to a destination somewhere ahead on the map.
For those with a sartorial bent we’d suggest the analogy of getting a trim or haircut in advance of a pending event.
The timing of the recent waft of negativity, which saw theS&P 500 end last week at 2047.60 or 1.2% off its 2016 high of 2072.78 reached on April 1, worked almost like clockwork as time grew closer to the unofficial start of Q1 earnings season when Alcoa (AA) reports first- quarter results (after the market’s close today) and optimism turned to skepticism about growth linked to the economy, revenues and earnings.
Such market action seems to us to have become fairly common on and around quarterly earnings seasons, Fed minutes releases, and in response to remarks by Fed officials in what has become termed as periods of “Fed-speak.” (This week four Fed regional presidents are scheduled to appear at events around the country.)
Focus on the Bond Market
In bond land interest rates have moved lower this year as bond market participants bid bond prices higher after the Fed Chair’s remarks in the week prior to last and after investors’ perusal of the FOMC minutes released last week.
As markets have sought and found well-worn catalysts to gnarl and gnaw on once again over the last week, markets switched from “risk on” to “risk off” and back to “risk on” with varying degrees of fleeting conviction.
By last Friday the:
2-year Treasury yield stood at 0.697%, down from 1.05% at the start of the year;
10-year Treasury yield stood at 1.72%, down from 2.27% at the start of the year;
30-year Treasury yield stood at 2.55%, down from 3.02% at the start of the year.
Ten- and Two-Year Treasury Note Yields YTD
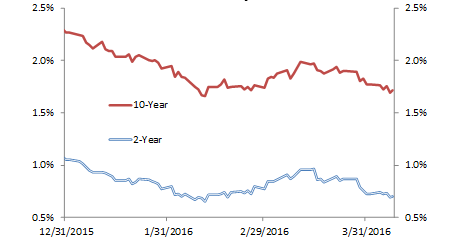
Source: Bloomberg, OAM Research.
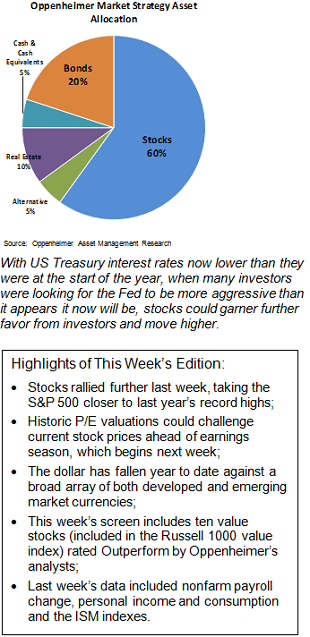
As much as some investors want rates to rise, we’re prodded to suggest that the markets can’t merely wish interest rates higher.
While interest rates can move higher on projections and expectations of inflation, they won’t stick higher without some degree of inflation.We recall 2013 when the yield on the 10-year Treasury advanced from a low of 1.62% on May 2nd of that year to a high of 3.03% on December 31st on market participants’ projections of what would be the outcome of the process of Fed tapering that then Fed Chairman Ben Bernanke had introduced as a concept in May of that year.
Thirty- and Ten-Year US Treasury Yields YTD
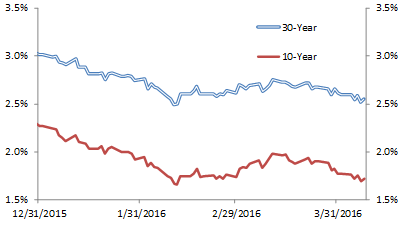
Source: Bloomberg, OAM Research.
While higher commodity prices can provide a whiff of inflation, higher prices are unlikely to stick if wages don’t or can’t rise to make higher prices affordable for the consumer and inflation sustainable.
Investors stateside face a busy week ahead with:
Earnings results this week from a number of bellwether stocks belonging to cyclical sectors that include: materials, financials, industrials and consumer discretionary.
Economic data including:
Advance retail sales (Wednesday); The producer price index (Wednesday); Business inventory revisions (Wednesday); The Fed’s Beige Book (Wednesday); The CPI (Thursday); Personal (weekly) earnings growth (Thursday); Along with data on Friday that includes manufacturing, consumer sentiment, industrial production and capacity utilization along with the Treasury’s TIC data (a measure of foreign investment flows into and out of US assets).
From a global perspective the IMF issues its World Economic Outlook on Tuesday followed by a briefing on the Global Policy Agenda on Thursday.
Earnings Season Preview
FactSet reports that for Q1 S&P 500 earnings season analysts expect earnings to drop -9.1%.
As recently as December 31st of last year expectations for Q1 were for a 0.7% increase in earnings.
The Energy sector has recorded the largest decrease in earnings expectations for the quarter to -103.8% from an earlier projection of -43.8%.
For a fourth consecutive earnings season the Energy sector is expected to drag the overall earnings of the benchmark lower.
Ahead of Q1 earnings season, all ten sectors have seen declines in earnings growth expectations to date.
While Alcoa unofficially opens earnings season today, 22 companies thus far have reported Q1 results. FactSet shows that 19 of those companies have reported earnings above the mean estimate while 14 have reported sales above the mean estimate.
For yet another quarter analysts’ downward revisions to estimates ahead of earnings season may be deep enough once again to make the earnings season’s bark is worse than its bite.
Stay tuned.
For the complete report, please contact your Oppenheimer Financial Advisor.
Potential Conflicts of Interest
Strategic analysts employed by Oppenheimer & Co. Inc. are compensated from revenues generated by the firm. Oppenheimer & Co. Inc. generally prohibits strategists and members of his or her households from executing trades in the securities of a company that is discussed in a strategy report. . Recipients of this report are advised that any or all of the foregoing as well as more specific disclosures set forth below, may at times give rise to potential conflicts of interest.
Other Disclosures
This report is issued and approved by Oppenheimer & Co. Inc., a member of all Principal Exchanges, and SIPC. This report is distributed by Oppenheimer & Co. Inc., for informational purposes only, to its institutional and retail investor clients. This report does not constitute an offer or solicitation to buy or sell any securities discussed herein in any jurisdiction where such offer or solicitation would be prohibited. The securities mentioned in this report may not be suitable for all types of investors. This report does not take into account the investment objectives, financial situation or specific needs of any particular client of Oppenheimer & Co. Inc. Recipients should consider this report as only a single factor in making an investment decision and should not rely solely on investment recommendations contained herein, if any, as a substitution for the exercise of independent judgment of the merits and risks of investments. The strategist writing this report is not a person or company with actual, implied or apparent authority to act on behalf of any issuer mentioned in the report. Before making an investment decision with respect to any security discussed in this report, the recipient should consider whether such investment is appropriate given the recipient's particular investment needs, objectives and financial circumstances. We recommend that investors independently evaluate particular investments and strategies, and encourage investors to seek the advice of a financial advisor. Oppenheimer & Co. Inc. will not treat non-client recipients as its clients solely by virtue of their receiving this report. Past performance is not a guarantee of future results, and no representation or warranty, express or implied, is made regarding future performance of any security mentioned in this report. The price of the securities mentioned in this report and the income they produce may fluctuate and/or be adversely affected by exchange rates, and investors may realize losses on investments in such securities, including the loss of investment principal.
Oppenheimer & Co. Inc. accepts no liability for any loss arising from the use of information contained in this report. All information, opinions and statistical data contained in this report were obtained or derived from public sources believed to be reliable, but Oppenheimer & Co. Inc. does not represent that any such information, opinion or statistical data is accurate or complete and they should not be relied upon as such. All estimates and opinions expressed herein constitute judgments as of the date of this report and are subject to change without notice. Nothing in this report constitutes legal, accounting or tax advice. Since the levels and bases of taxation can change, any reference in this report to the impact of taxation
INVESTMENT STRATEGY
should not be construed as offering tax advice on the tax consequences of investments. As with any investment having potential tax implications, clients should consult with their own independent tax adviser.
This report may provide addresses of, or contain hyperlinks to, Internet web sites. Oppenheimer & Co. Inc. has not reviewed the linked Internet web site of any third party and takes no responsibility for the contents thereof. Each such address or hyperlink is provided solely for the recipient's convenience and information, and the content of linked third party web sites is not in any way incorporated into this document. Recipients who choose to access such third-party web sites or follow such hyperlinks do so at their own risk. The S&P 500 Index is an unmanaged value-weighted index of 500 common stocks that is generally considered representative of the U.S. stock market. The S&P 500 index figures do not reflect any fees, expenses or taxes. This research is distributed in the UK and elsewhere throughout Europe, as third party research by Oppenheimer Europe Ltd, which is authorized and regulated by the Financial Conduct Authority (FCA). This research is for information purposes only and is not to be construed as a solicitation or an offer to purchase or sell investments or related financial instruments. This report is for distribution only to persons who are eligible counterparties or professional clients and is exempt from the general restrictions in section 21 of the Financial Services and Markets Act 2000 on the communication of invitations or inducements to engage in investment activity on the grounds that it is being distributed in the UK only to persons of a kind described in Article 19(5) (Investment Professionals) and 49(2) High Net Worth companies, unincorporated associations etc.) of the Financial Services and Markets Act 2000 (Financial Promotion) Order 2005 (as amended). It is not intended to be distributed or passed on, directly or indirectly, to any other class of persons. In particular, this material is not for distribution to, and should not be relied upon by, retail clients, as defined under the rules of the FCA. Neither the FCA’s protection rules nor compensation scheme may be applied. This report or any portion hereof may not be reprinted, sold, or redistributed without the written consent of Oppenheimer & Co. Inc. Copyright © Oppenheimer & Co. Inc. 2015.
