Everyday, Everyday I Have the Blues
By John Stoltzfus,
Chief Investment Strategist
Patience Rewarded
The DJIA and S&P 500 cross into positive territory for the year
With the S&P 500 and the Dow Jones Industrials now having traveled a round trip and a little distance higher since the start of the year, the questions investors are asking themselves and each other are “what next?” and “where to from here?”
After stumbling badly at the start of the year on growth, recession and currency devaluation fears through February 11th, stocks have since that date moved higher through last Friday with the Dow Jones Industrials, the S&P 500, the S&P 400 (mid-caps), the Russell 2000 (small caps) and the Nasdaq respectively advancing: 12.4%, 12.06%, 15.42%, 15.51% and 12.39%.
A mix of positive economic data, a rebound in oil and other commodity prices (suggesting oil and an assortment of other commodity prices are stabilizing), along with some good corporate news items brought a change-of-pace feel to the market scene and turned the beat around in a pronounced fashion.
Aiding and abetting the stabilization (and in some cases rebound) in commodity prices, the noticeable decline in the dollar against a broad array of currencies from among both developed and emerging markets has also helped to bring some stability to markets and the world economic outlook.
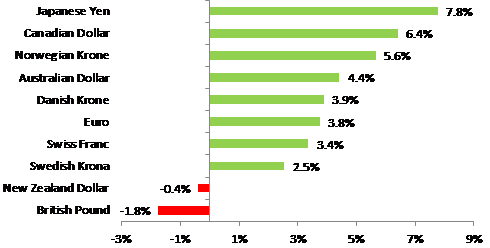
As of last Friday, eight of ten G-10 currencies were up year to date against the dollar ranging from a rise of 2.55% (Swedish krona) to as much as 7.77% (Japanese Yen). The euro and the Canadian dollar in the same period gained 3.76% and 6.42% respectively against the dollar. (See currency charts on the next page).
Among emerging markets, 18 nations have seen their currency rise against the US dollar year to date from as little as 0.34% (Chinese renminbi), 0.86% (Korean won) to as much as 9.36% (Brazilian real) and 7.65% (Russian ruble).
Change in Currency Value versus U.S. Dollar
in Year to Date through March 18, 2016.
G-10 Currencies:
Emerging Market Nation Currencies:
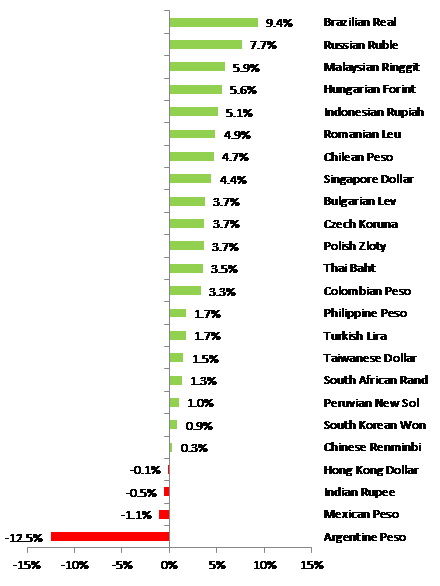
Source: Bloomberg, OAM Research.
Much of the gains against the dollar can be attributed to the US Federal Reserve’s consideration of the current state of the global economy in setting its current monetary policy.
After the FOMC meeting last week Fed Chair Janet Yellen reiterated that the US central bank will continue to give significant weight to the condition and recovery progress of economies outside of the US.
The Fed has acted much as we had expected it to and reminded us often of the market adage “don’t fight the Fed”.
Chair Yellen’s comments last week helped provide more wind under the market’s wings as even skeptics last week appeared to begin to opt not to fight the Fed. Going into last week’s FOMC meeting, the market still carried concerns that the Fed was still planning on four rate hikes to its Fed Funds rate in 2016. That concern was somewhat assuaged last week with the Fed speaking of its plans for two hikes instead of four in 2016 and with interest rate futures pointing more confidently as a result toward only one hike this year.
Based on the market’s positive trajectory since February 11th and the significant amount of ground regained from earlier losses this year, major averages appear to us likely to experience at least some profit taking before they move significantly higher.
As we mentioned in this publication last week, investors should not be surprised if the market pauses sooner than later to seek a catalyst before it moves much higher from present levels.
First quarter earnings season unofficially starts in a few weeks when Alcoa presents 1Q results on April 11th after the market close. With consensus analyst opinions already having drastically cut expectations, earnings season when it arrives, will likely find investors keenly focused on results and guidance from company managements for what might lie ahead.
In the interim we’d expect the market to become more sensitive to news items in a presidential election year that are political or geopolitical in nature, commodity price-related as well as economic data and corporate announcements.
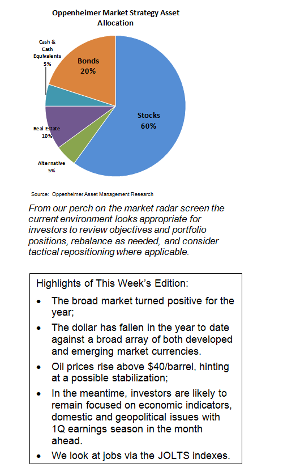
From our perch on the market radar screen the current environment looks appropriate for investors to review objectives and portfolio positions, rebalance as needed, and consider tactical repositioning where applicable.
We continue to favor alpha (active management/individual stock selection) over beta (passive management/indexing) as well as industry/sector emphasis that favors cyclical sectors (positively sensitive to economic growth) over defensive sectors (those less sensitive to shifts in the economy).
Cyclical dividend plays remain among our favorites in an environment in which the economic expansion appears sustainable but wherein the economy remains highly susceptible to transitional uncertainties tied to technology and globalization and the effects of those trends nearer term on labor, supply and demand, disinflation risk (stateside), deflation risks (abroad), and the resultant need (evidenced by central bank monetary policies around the world) for economies around the world to reflate (grow again or grow at a stronger pace).
In such an environment investing for total return makes sense to us. We like to see investors “get paid while they wait” via dividends from stocks that also have good potential for capital appreciation.
With the Fed remaining in a data-sensitive mode and closely observing stateside and international economies, we continue to believe interest rates are likely to remain low for longer—contrary to what interest rate “hawks” expect.
Much is said in the press about some private investors’ reluctance to add exposure to equities in their portfolios in a post tech-bubble, post financial crisis and housing bubble era.
With the US now in its eighth year of low to near zero interest rates across a wide array of fixed income investments, we’d expect those “still reluctant” investors may soon be willing to “dip their toes in the water” and add dividend-paying stocks to their investment mix.
Russell Growth and Value Indexes YTD 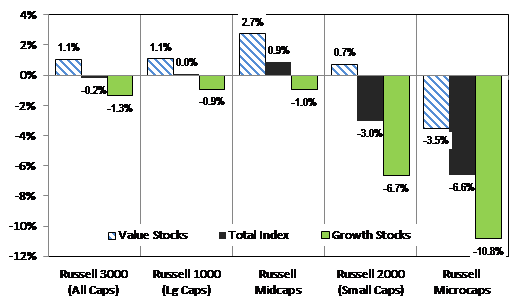
Source: Russell Associates, Bloomberg and OAM Research. Change in index values from 12/31/2015 to 3/18/2016.
This may already have begun as the allure of many pure growth stocks to investors has given way to value stocks.
If indeed just a small portion of investable assets relegated and allocated to cash over the past seven plus years gets repositioned into stocks, P/E multiples may have further to expand.
In the market’s holiday-abridged week ahead, economic data tied to manufacturing including durable goods as well as that related to housing, jobs and services are slated to cross the tape. On Friday when the stock and bond markets are closed in observance of Good Friday, the final read on 4Q 2015 GDP is scheduled to be released.
A survey of economists shows expectations for 0.9% or no change from the prior read. A stronger than expected GDP number could provide the market a catalyst to move higher when investors and traders come back after the long weekend.
Our mantra: practice patience.
Stay tuned.
For the complete report, please contact your Oppenheimer Financial Advisor.
Potential Conflicts of Interest
Strategic analysts employed by Oppenheimer & Co. Inc. are compensated from revenues generated by the firm. Oppenheimer & Co. Inc. generally prohibits strategists and members of his or her households from executing trades in the securities of a company that is discussed in a strategy report. . Recipients of this report are advised that any or all of the foregoing as well as more specific disclosures set forth below, may at times give rise to potential conflicts of interest.
Other Disclosures
This report is issued and approved by Oppenheimer & Co. Inc., a member of all Principal Exchanges, and SIPC. This report is distributed by Oppenheimer & Co. Inc., for informational purposes only, to its institutional and retail investor clients. This report does not constitute an offer or solicitation to buy or sell any securities discussed herein in any jurisdiction where such offer or solicitation would be prohibited. The securities mentioned in this report may not be suitable for all types of investors. This report does not take into account the investment objectives, financial situation or specific needs of any particular client of Oppenheimer & Co. Inc. Recipients should consider this report as only a single factor in making an investment decision and should not rely solely on investment recommendations contained herein, if any, as a substitution for the exercise of independent judgment of the merits and risks of investments. The strategist writing this report is not a person or company with actual, implied or apparent authority to act on behalf of any issuer mentioned in the report. Before making an investment decision with respect to any security discussed in this report, the recipient should consider whether such investment is appropriate given the recipient's particular investment needs, objectives and financial circumstances. We recommend that investors independently evaluate particular investments and strategies, and encourage investors to seek the advice of a financial advisor. Oppenheimer & Co. Inc. will not treat non-client recipients as its clients solely by virtue of their receiving this report. Past performance is not a guarantee of future results, and no representation or warranty, express or implied, is made regarding future performance of any security mentioned in this report. The price of the securities mentioned in this report and the income they produce may fluctuate and/or be adversely affected by exchange rates, and investors may realize losses on investments in such securities, including the loss of investment principal.
Oppenheimer & Co. Inc. accepts no liability for any loss arising from the use of information contained in this report. All information, opinions and statistical data contained in this report were obtained or derived from public sources believed to be reliable, but Oppenheimer & Co. Inc. does not represent that any such information, opinion or statistical data is accurate or complete and they should not be relied upon as such. All estimates and opinions expressed herein constitute judgments as of the date of this report and are subject to change without notice. Nothing in this report constitutes legal, accounting or tax advice. Since the levels and bases of taxation can change, any reference in this report to the impact of taxation
INVESTMENT STRATEGY
should not be construed as offering tax advice on the tax consequences of investments. As with any investment having potential tax implications, clients should consult with their own independent tax adviser.
This report may provide addresses of, or contain hyperlinks to, Internet web sites. Oppenheimer & Co. Inc. has not reviewed the linked Internet web site of any third party and takes no responsibility for the contents thereof. Each such address or hyperlink is provided solely for the recipient's convenience and information, and the content of linked third party web sites is not in any way incorporated into this document. Recipients who choose to access such third-party web sites or follow such hyperlinks do so at their own risk. The S&P 500 Index is an unmanaged value-weighted index of 500 common stocks that is generally considered representative of the U.S. stock market. The S&P 500 index figures do not reflect any fees, expenses or taxes. This research is distributed in the UK and elsewhere throughout Europe, as third party research by Oppenheimer Europe Ltd, which is authorized and regulated by the Financial Conduct Authority (FCA). This research is for information purposes only and is not to be construed as a solicitation or an offer to purchase or sell investments or related financial instruments. This report is for distribution only to persons who are eligible counterparties or professional clients and is exempt from the general restrictions in section 21 of the Financial Services and Markets Act 2000 on the communication of invitations or inducements to engage in investment activity on the grounds that it is being distributed in the UK only to persons of a kind described in Article 19(5) (Investment Professionals) and 49(2) High Net Worth companies, unincorporated associations etc.) of the Financial Services and Markets Act 2000 (Financial Promotion) Order 2005 (as amended). It is not intended to be distributed or passed on, directly or indirectly, to any other class of persons. In particular, this material is not for distribution to, and should not be relied upon by, retail clients, as defined under the rules of the FCA. Neither the FCA’s protection rules nor compensation scheme may be applied. This report or any portion hereof may not be reprinted, sold, or redistributed without the written consent of Oppenheimer & Co. Inc. Copyright © Oppenheimer & Co. Inc. 2015.
