Everyday, Everyday I Have the Blues
By John Stoltzfus,
Chief Investment Strategist
You Can’t Have Your Cake and Eat It Too…Or Can You?
Nonfarm payroll number and other economic data let the Fed off the hook for September
With a little perspective on it, last week’s nonfarm payroll number along with a whole packet of other data that has crossed the transom of late might just be what the Fed needs to justify to Fed watchers a deferral of a rate hike in September, while still leaving the door comfortably open to raise rates in December.
Last week’s ISM manufacturing data (at 49.4 vs. 52.1 expected) along with housing data released in the prior week (positive surprise for new home sales, disappoint in existing sales) along with auto sales (per Ward’s total vehicle sales report) for August (at 16.91M annualized, though shy of expectations for 17.2M annualized) helped crimp sentiment for a September rate hike but didn’t get in the way of stocks moving higher on Friday: The broad market (S&P 500) rose 0.42% on the day, while the S&P 400 (mid-caps) and the S&P 600 (small-caps) posted respective gains of 0.97% and 1.16%.
The market seemed to say that last week’s economic data wasn’t as much of a negative surprise as some investors and pundits tried to make of it as well as not good enough to set off Fed rate hike alerts in nervous segments of the market. p>
While the non-farm payroll number at 151,000 was a fifth off (or 20%) where a survey of economists had projected it would be, it was also not so far from expectations to rattle the equity market much, if at all.
For long-term fans of the economic recovery that has emerged beyond the Great Crisis into the current stateside economic expansion, last week’s payroll number looked “good enough” in consideration of the two prior months’ gains.
Recall that the non-farm payroll number in June and July knocked the cover off the proverbial ball and surprised to the upside with considerable magnitude (June at 287,000 jobs added vs. expectations for 180,000); July at 255,000 jobs added versus expectations for 180,000).
And we can’t forget May, which surprised so harshly to the downside (initially at 38,000 vs. expectations for 160,000) that even “perma bears” appeared stunned at the number.
What to make of September?
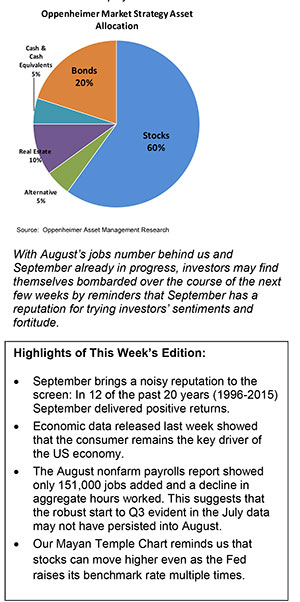
With August’s jobs number behind us and September already in progress investors may find themselves bombarded over the course of the next few weeks by reminders that September has a reputation for trying investors’ sentiments and fortitude.
We checked the performance of the S&P 500 in September over the last 20 years, from 1996 through 2015.
In that period 12 Septembers delivered positive results and eight were negative.
Where will September 2016 take us?
For the complete report, please contact your Oppenheimer Financial Advisor.
Other Disclosures
This report is issued and approved by Oppenheimer & Co. Inc., a member of all Principal Exchanges, and SIPC. This report is distributed by Oppenheimer & Co. Inc., for informational purposes only, to its institutional and retail investor clients. This report does not constitute an offer or solicitation to buy or sell any securities discussed herein in any jurisdiction where such offer or solicitation would be prohibited. The securities mentioned in this report may not be suitable for all types of investors. This report does not take into account the investment objectives, financial situation or specific needs of any particular client of Oppenheimer & Co. Inc. Recipients should consider this report as only a single factor in making an investment decision and should not rely solely on investment recommendations contained herein, if any, as a substitution for the exercise of independent judgment of the merits and risks of investments. The strategist writing this report is not a person or company with actual, implied or apparent authority to act on behalf of any issuer mentioned in the report. Before making an investment decision with respect to any security discussed in this report, the recipient should consider whether such investment is appropriate given the recipient's particular investment needs, objectives and financial circumstances. We recommend that investors independently evaluate particular investments and strategies, and encourage investors to seek the advice of a financial advisor. Oppenheimer & Co. Inc. will not treat non-client recipients as its clients solely by virtue of their receiving this report. Past performance is not a guarantee of future results, and no representation or warranty, express or implied, is made regarding future performance of any security mentioned in this report. The price of the securities mentioned in this report and the income they produce may fluctuate and/or be adversely affected by exchange rates, and investors may realize losses on investments in such securities, including the loss of investment principal.
Oppenheimer & Co. Inc. accepts no liability for any loss arising from the use of information contained in this report. All information, opinions and statistical data contained in this report were obtained or derived from public sources believed to be reliable, but Oppenheimer & Co. Inc. does not represent that any such information, opinion or statistical data is accurate or complete and they should not be relied upon as such. All estimates and opinions expressed herein constitute judgments as of the date of this report and are subject to change without notice. Nothing in this report constitutes legal, accounting or tax advice. Since the levels and bases of taxation can change, any reference in this report to the impact of taxation
INVESTMENT STRATEGY
should not be construed as offering tax advice on the tax consequences of investments. As with any investment having potential tax implications, clients should consult with their own independent tax adviser.
This report may provide addresses of, or contain hyperlinks to, Internet web sites. Oppenheimer & Co. Inc. has not reviewed the linked Internet web site of any third party and takes no responsibility for the contents thereof. Each such address or hyperlink is provided solely for the recipient's convenience and information, and the content of linked third party web sites is not in any way incorporated into this document. Recipients who choose to access such third-party web sites or follow such hyperlinks do so at their own risk. The S&P 500 Index is an unmanaged value-weighted index of 500 common stocks that is generally considered representative of the U.S. stock market. The S&P 500 index figures do not reflect any fees, expenses or taxes. This research is distributed in the UK and elsewhere throughout Europe, as third party research by Oppenheimer Europe Ltd, which is authorized and regulated by the Financial Conduct Authority (FCA). This research is for information purposes only and is not to be construed as a solicitation or an offer to purchase or sell investments or related financial instruments. This report is for distribution only to persons who are eligible counterparties or professional clients and is exempt from the general restrictions in section 21 of the Financial Services and Markets Act 2000 on the communication of invitations or inducements to engage in investment activity on the grounds that it is being distributed in the UK only to persons of a kind described in Article 19(5) (Investment Professionals) and 49(2) High Net Worth companies, unincorporated associations etc.) of the Financial Services and Markets Act 2000 (Financial Promotion) Order 2005 (as amended). It is not intended to be distributed or passed on, directly or indirectly, to any other class of persons. In particular, this material is not for distribution to, and should not be relied upon by, retail clients, as defined under the rules of the FCA. Neither the FCA’s protection rules nor compensation scheme may be applied. This report or any portion hereof may not be reprinted, sold, or redistributed without the written consent of Oppenheimer & Co. Inc. Copyright © Oppenheimer & Co. Inc. 2015.
