Everyday, Everyday I Have the Blues
By John Stoltzfus,
Chief Investment Strategist
Rock Steady
Strategic musings on the current bull market
Last Thursday three of the major stateside equity indices delivered investors a veritable trifecta as the S&P 500, The Dow Jones Industrial Average, and the NASDAQ closed at all-time highs on the same day.
The occurrence was widely noted in the press and around the market with bearish types pointing out that the last time three major stateside indices had posted record highs on the same day was on December 31, 1999 near the peak of the technology bubble.
However, bulls and even a few market skeptics were quick to reject that the similarity would lead to the same result. The two periods (then and now) are decidedly different, with a dearth of “animal spirits” and no signs (that we can see) of “irrational exuberance” at the present time.
“Back in the day” of the tech bubble, valuations, investor expectations, sentiment, and attitudes were so out of line with reality that they’d have made Pollyanna blush.
For example, the NASDAQ traded at a trailing earnings multiple of 24x as of last week versus 59x at the end of December 1999.
The S&P 500 closed last week at a trailing earnings multiple of 20.5x. At the end of 1999, the S&P 500 sported a trailing P/E multiple of 29.3x having peaked even higher at 30.7x on July 16, 1999.
Today investors find themselves in the midst of the most doubted and even despised bull market that Wall Street “long-timers” can recall.
The current market appears to lack the hubris that usually develops over the course of longer-term bull markets. There’s no “Let the Good Times Roll” party feel nearly 7.5 years from the start of the Bull market. Earnings for Wall Street firms are challenged in this cycle, not robust as they were in the tech bubble.
It’s usually hubris that leads over confident bull markets in their later stages to the proverbial slaughter house.
The current bull market (which began after the S&P 500 hit its low on March 9, 2009) appears relatively humble and ‘right-sized’ compared to others we’ve experienced in our tenure of over 30 years in the markets.
The complacency that usually surfaces and lingers in bull markets has not had much opportunity to develop or last on the timeline that corresponds to the current market.
Perhaps it’s the digitalization of information flow that discounts and measures news that impacts the markets, or the globalization embedded in the markets, that keeps investment flows in active rotation which have precluded excesses from reaching levels seen in past bull markets.
It seems to us that gains thus far have been earned by the market rather than readily given. Our recollection of the tech bubble provides little comparison to today’s day-to-day activities, as worry and concern seemed to have been “placed on hold” or even “thrown out the window” by too many market participants in the earlier period.
In the current cycle, it looks to us that the market has determinedly climbed a “wall of worry” supported not solely by monetary policy, but by improving economic fundamentals and market trends.
Along the way, catalysts deemed worthy to generate corrections, pullbacks, “trims” and “haircuts” have resulted in downdrafts that have caused the progress of the market to take detours from an upward trajectory, rather than end its journey toward a higher ground.
Partly as a result of these patterns and trends, the current bull market has become the second longest in US history, surpassed only by the bull market which ran from 1987 to 2000.
We believe that as long as complacency and hubris are kept in check, a mix of accommodative monetary policy, low interest rates, moderate commodity pricing, a competitive dollar, low energy prices, and modest wage gains could continue to support a sustainable stateside economic recovery, with further corresponding gains in equities.
While much has been made of late of the S&P 500’s nine recent “new record highs” since July 11th, the percentage gains from one high to the next have been relatively small and resulted from a tendency for the market to “grind higher” rather than surge upwards. The respective percentage gains of this year’s nine record highs from the prior record high have been:
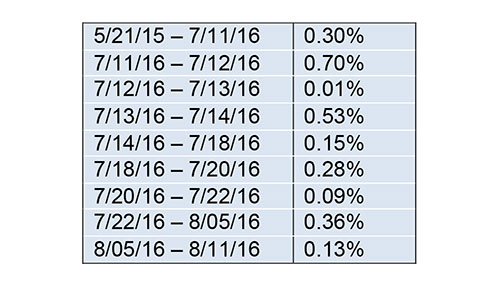
It has taken the S&P 500 nearly 14 months to advance 2.6% from a closing record high of 2,130.82 on May 21st, 2015 through the most recent closing record high of 2,185.79 last Thursday August 11th, 2016.
Withn the same 15-month period in 1999, the S&P 500 advanced 18.3%.
When comparing the two, the pace of gains in the current bull market has been a relentless grind rather than the raging bull that was the tech bubble.
In our view, the S&P 500’s first record high in 2016 didn’t take place until the market had “paid its dues” including drubbings last August as well as January of this year on concerns tied to growth, Fed policy, and Chinese currency devaluation.
While Britain’s “Brexit” vote in June rattled the stateside markets, it was only for a matter of days (June 23 – June 27).
So far the current bull market has rewarded investors’ patience as well as the fortitude to buy and add on dips.
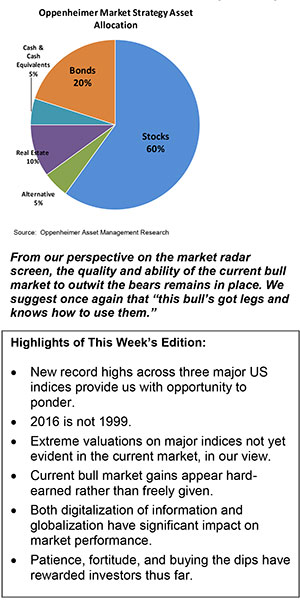
From our perspective on the market radar screen, the quality and ability of the current bull market to outwit the bears remains in place. We suggest once again that “this bull’s got legs and knows how to use them.”
For the complete report, please contact your Oppenheimer Financial Advisor.
Other Disclosures
This report is issued and approved by Oppenheimer & Co. Inc., a member of all Principal Exchanges, and SIPC. This report is distributed by Oppenheimer & Co. Inc., for informational purposes only, to its institutional and retail investor clients. This report does not constitute an offer or solicitation to buy or sell any securities discussed herein in any jurisdiction where such offer or solicitation would be prohibited. The securities mentioned in this report may not be suitable for all types of investors. This report does not take into account the investment objectives, financial situation or specific needs of any particular client of Oppenheimer & Co. Inc. Recipients should consider this report as only a single factor in making an investment decision and should not rely solely on investment recommendations contained herein, if any, as a substitution for the exercise of independent judgment of the merits and risks of investments. The strategist writing this report is not a person or company with actual, implied or apparent authority to act on behalf of any issuer mentioned in the report. Before making an investment decision with respect to any security discussed in this report, the recipient should consider whether such investment is appropriate given the recipient's particular investment needs, objectives and financial circumstances. We recommend that investors independently evaluate particular investments and strategies, and encourage investors to seek the advice of a financial advisor. Oppenheimer & Co. Inc. will not treat non-client recipients as its clients solely by virtue of their receiving this report. Past performance is not a guarantee of future results, and no representation or warranty, express or implied, is made regarding future performance of any security mentioned in this report. The price of the securities mentioned in this report and the income they produce may fluctuate and/or be adversely affected by exchange rates, and investors may realize losses on investments in such securities, including the loss of investment principal.
Oppenheimer & Co. Inc. accepts no liability for any loss arising from the use of information contained in this report. All information, opinions and statistical data contained in this report were obtained or derived from public sources believed to be reliable, but Oppenheimer & Co. Inc. does not represent that any such information, opinion or statistical data is accurate or complete and they should not be relied upon as such. All estimates and opinions expressed herein constitute judgments as of the date of this report and are subject to change without notice. Nothing in this report constitutes legal, accounting or tax advice. Since the levels and bases of taxation can change, any reference in this report to the impact of taxation
INVESTMENT STRATEGY
should not be construed as offering tax advice on the tax consequences of investments. As with any investment having potential tax implications, clients should consult with their own independent tax adviser.
This report may provide addresses of, or contain hyperlinks to, Internet web sites. Oppenheimer & Co. Inc. has not reviewed the linked Internet web site of any third party and takes no responsibility for the contents thereof. Each such address or hyperlink is provided solely for the recipient's convenience and information, and the content of linked third party web sites is not in any way incorporated into this document. Recipients who choose to access such third-party web sites or follow such hyperlinks do so at their own risk. The S&P 500 Index is an unmanaged value-weighted index of 500 common stocks that is generally considered representative of the U.S. stock market. The S&P 500 index figures do not reflect any fees, expenses or taxes. This research is distributed in the UK and elsewhere throughout Europe, as third party research by Oppenheimer Europe Ltd, which is authorized and regulated by the Financial Conduct Authority (FCA). This research is for information purposes only and is not to be construed as a solicitation or an offer to purchase or sell investments or related financial instruments. This report is for distribution only to persons who are eligible counterparties or professional clients and is exempt from the general restrictions in section 21 of the Financial Services and Markets Act 2000 on the communication of invitations or inducements to engage in investment activity on the grounds that it is being distributed in the UK only to persons of a kind described in Article 19(5) (Investment Professionals) and 49(2) High Net Worth companies, unincorporated associations etc.) of the Financial Services and Markets Act 2000 (Financial Promotion) Order 2005 (as amended). It is not intended to be distributed or passed on, directly or indirectly, to any other class of persons. In particular, this material is not for distribution to, and should not be relied upon by, retail clients, as defined under the rules of the FCA. Neither the FCA’s protection rules nor compensation scheme may be applied. This report or any portion hereof may not be reprinted, sold, or redistributed without the written consent of Oppenheimer & Co. Inc. Copyright © Oppenheimer & Co. Inc. 2015.
