Everyday, Everyday I Have the Blues
By John Stoltzfus,
Chief Investment Strategist
Rollin’, Rollin’, Rollin’ on the River
The July payroll figure raised sentiment and boosted stocks to new record highs
The July non-farm payroll number released last Friday substantially beat expectations and set off a stock
market rally that pushed the S&P 500 to a new record-high closing price of 2,182.87. It was the eighth record high for the benchmark this year since crossing 2137.16 on July 11th.
Expectations had been for the jobs number to come in around 180,000 based on a pre-release Bloomberg survey of economists.
Coming in at 255,000, the actual number turned heads, sent stock prices higher, bond prices lower and yields higher, particularly in the 2- to 10-year US Treasury maturity range, as oil and gold slipped.
After the number was released, Fed funds futures saw the probability of a Fed rate hike in September jump to 26% from 18% the day before (a 44% increase in probability). For December the probability of a Fed rate hike rose from 37.3% to 46.7% (a 25% increase in probability).
Adding to the good news for the market on Friday was a positive revision for the June payroll number, which had already substantially exceeded expectations last month at 287,000. That number was revised higher to 292,000.
Memory of the May figure, which in contrast to the last two monthly numbers had generated much gnashing of teeth, seemed to vanish in an instant last Friday.
While the May number had distressed and shocked many investors and observers at 38,000 jobs added vs. expectations for 160,000 jobs when the number was released in early June, the market has since been able to brush that worry aside as more positive economic data from a variety of sources has offset negative news and data points and provided a level of resilience that has begun to be noticed among active investors and observers.
Such is the opportunity for variance and volatility in data as well as the memory and attention span in the marketplace.
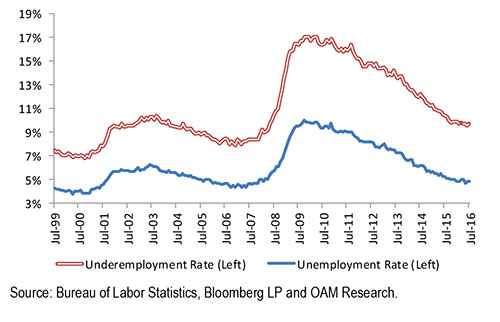
The monthly unemployment number eased to 4.7% in July from 4.9% in the prior month (see figure below). The labor force participation rate (the share of working age individuals who are employed or looking for work) edged higher to 62.8% from 62.7%, likely reflecting more people coming into the workforce.
Friday’s data pointed to a broad gain in the payroll number that included jobs in manufacturing, health care, retailing, leisure and hospitality as well as at temporary help agencies. Government agencies added some 38,000 jobs last month, the most since September 2014.
Wages ticked higher, albeit at a continued modest pace, as average hourly earnings rose 0.3% from the prior month. Year-over-year wages were up 2.6% in July
One area of disappointment among the latest jobrelated data was the “underemployment rate” (the U-6), which rose to 9.7% in July from 9.6% in the prior month as the number of part-timers for economic reasons increased to 5.94 million from 5.84 million. The number of workers who stopped looking because of poor prospects rose to 591,000, a five-month high.
That notwithstanding, the U6 number has improved notably from the end of November 2010, when it stood at 16.9% (see figure below).
The Unemployment and Underemployment Rates
The price of oil edged nearly half a percent higher over the course of last week. Oil bounced between gains and losses, falling in three out of five sessions, offset by a strong two-day rally mid-week (when it rose respectively 3.3% and 2.7%) before slipping lower on Friday.
The price of oil last Friday stood:
West Texas Intermediate Crude Oil Prices
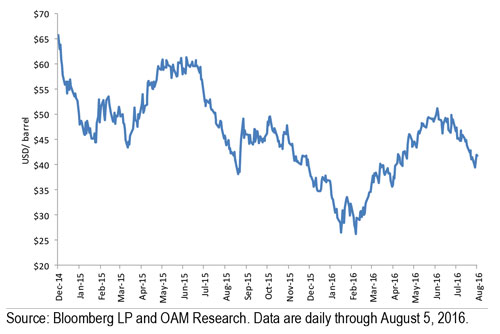
The volatility in “the black gold” this year has been caused by an abundance of factors including supply, strikes, fires, refiner seasonality, the strength/weakness of the US dollar, geopolitics, global economics as well as secular trends tied to technology and alternative energies.
US Crude Oil Production and Rig Count
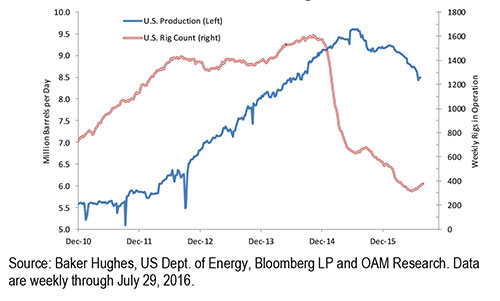
The price could be further tested as US oil producers add rigs in the shale-producing regions. Baker Hughes reported last week that the rig count rose by seven to 381 rigs. The average rig count from the start of the year stands at 386, down from a high of 536 rigs on the first day of January (see figure above).
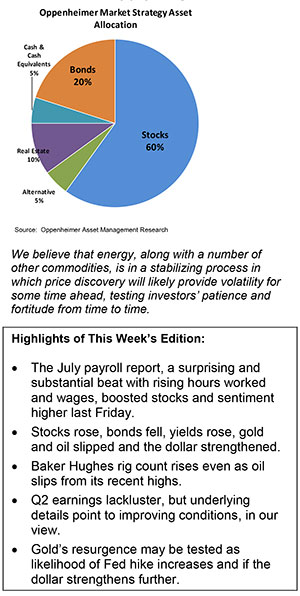
We continue to recommend underweighting exposure to the Energy sector. Our current weighting recommendation stands at a 5.5% weighting vs. the sector’s current 6.92% weight in the benchmark.
We believe that energy along with a number of other commodities is in a stabilizing process in which price discovery will likely provide volatility (particularly in energy) for some time ahead, testing investors’ patience and fortitude from time to time.
With the market’s perception of an increased chance of a rate hike (or maybe even two hikes) this year, gold has experienced some downside pressure of late. Standing 25.6% above where it started the year, gold last Friday was off just 2.3% from its year-to-date high ($1,335.55/oz.) reached on July 8.
The direction of the dollar and prospects for at least one rate hike this year could keep gold from extending its gains much further should the Fed raise its benchmark rate this year and should the dollar retain its current strength.
As Q2 earnings season nears its conclusion with 86% of the companies in the S&P 500 having reported through last Friday, results have once again exceeded expectations even as the benchmark records five consecutive quarters of year-over-year declines in earnings.
As of last Friday FactSet showed a blended (combines actual results for companies that have reported and estimated results for companies yet to report) year-over-year earnings decline for the S&P 500 of -3.5%, considerably better than the -5.5% estimated decline in earnings at the end of June. To date 69% have reported earnings that beat the mean estimate and 54% have reported revenues (sales) above the mean estimate.
The Health Care and Information Technology sectors have the highest percentages of companies reporting above estimates, while Telecom, Utilities and Materials have the lowest percentages of companies reporting earnings above estimates.
The Energy sector continues, as expected, to have the largest year-over-year decline in earnings (-82%) of the ten sectors of the S&P 500. Within its subsectors the only sub-industry to report earnings growth for the quarter has been the Oil & Gas Storage Transportation sector.
In the weeks ahead, look for the Fed’s September meeting, the prospective outcome of the presidential election and its perceived implications for the markets to garner a greater share of investor attention.
For now we expect the day-to-day, week-to-week economic data and the remainder of the earnings season to keep investors occupied whether they are at the beach or back at their desks.
For the complete report, please contact your Oppenheimer Financial Advisor.
Other Disclosures
This report is issued and approved by Oppenheimer & Co. Inc., a member of all Principal Exchanges, and SIPC. This report is distributed by Oppenheimer & Co. Inc., for informational purposes only, to its institutional and retail investor clients. This report does not constitute an offer or solicitation to buy or sell any securities discussed herein in any jurisdiction where such offer or solicitation would be prohibited. The securities mentioned in this report may not be suitable for all types of investors. This report does not take into account the investment objectives, financial situation or specific needs of any particular client of Oppenheimer & Co. Inc. Recipients should consider this report as only a single factor in making an investment decision and should not rely solely on investment recommendations contained herein, if any, as a substitution for the exercise of independent judgment of the merits and risks of investments. The strategist writing this report is not a person or company with actual, implied or apparent authority to act on behalf of any issuer mentioned in the report. Before making an investment decision with respect to any security discussed in this report, the recipient should consider whether such investment is appropriate given the recipient's particular investment needs, objectives and financial circumstances. We recommend that investors independently evaluate particular investments and strategies, and encourage investors to seek the advice of a financial advisor. Oppenheimer & Co. Inc. will not treat non-client recipients as its clients solely by virtue of their receiving this report. Past performance is not a guarantee of future results, and no representation or warranty, express or implied, is made regarding future performance of any security mentioned in this report. The price of the securities mentioned in this report and the income they produce may fluctuate and/or be adversely affected by exchange rates, and investors may realize losses on investments in such securities, including the loss of investment principal.
Oppenheimer & Co. Inc. accepts no liability for any loss arising from the use of information contained in this report. All information, opinions and statistical data contained in this report were obtained or derived from public sources believed to be reliable, but Oppenheimer & Co. Inc. does not represent that any such information, opinion or statistical data is accurate or complete and they should not be relied upon as such. All estimates and opinions expressed herein constitute judgments as of the date of this report and are subject to change without notice. Nothing in this report constitutes legal, accounting or tax advice. Since the levels and bases of taxation can change, any reference in this report to the impact of taxation
INVESTMENT STRATEGY
should not be construed as offering tax advice on the tax consequences of investments. As with any investment having potential tax implications, clients should consult with their own independent tax adviser.
This report may provide addresses of, or contain hyperlinks to, Internet web sites. Oppenheimer & Co. Inc. has not reviewed the linked Internet web site of any third party and takes no responsibility for the contents thereof. Each such address or hyperlink is provided solely for the recipient's convenience and information, and the content of linked third party web sites is not in any way incorporated into this document. Recipients who choose to access such third-party web sites or follow such hyperlinks do so at their own risk. The S&P 500 Index is an unmanaged value-weighted index of 500 common stocks that is generally considered representative of the U.S. stock market. The S&P 500 index figures do not reflect any fees, expenses or taxes. This research is distributed in the UK and elsewhere throughout Europe, as third party research by Oppenheimer Europe Ltd, which is authorized and regulated by the Financial Conduct Authority (FCA). This research is for information purposes only and is not to be construed as a solicitation or an offer to purchase or sell investments or related financial instruments. This report is for distribution only to persons who are eligible counterparties or professional clients and is exempt from the general restrictions in section 21 of the Financial Services and Markets Act 2000 on the communication of invitations or inducements to engage in investment activity on the grounds that it is being distributed in the UK only to persons of a kind described in Article 19(5) (Investment Professionals) and 49(2) High Net Worth companies, unincorporated associations etc.) of the Financial Services and Markets Act 2000 (Financial Promotion) Order 2005 (as amended). It is not intended to be distributed or passed on, directly or indirectly, to any other class of persons. In particular, this material is not for distribution to, and should not be relied upon by, retail clients, as defined under the rules of the FCA. Neither the FCA’s protection rules nor compensation scheme may be applied. This report or any portion hereof may not be reprinted, sold, or redistributed without the written consent of Oppenheimer & Co. Inc. Copyright © Oppenheimer & Co. Inc. 2015.
