Everyday, Everyday I Have the Blues
By John Stoltzfus,
Chief Investment Strategist
Summertime and the Market Is Easy?
The market faced a number of hurdles last week but
cleared each with a minimum of drama
Perhaps it wasn’t as much summer doldrums on Wall Street last week but as the dog days of summer heat combined with vacation time across trading desks that saw the market churn its way with considerable ease through: a large sample of second-quarter earnings, the Fed FOMC meeting and a disappointing first read on Q2 GDP (growth at 1.2% versus a Bloomberg survey of economists looking for y-o-y growth of 2.5%). Add to that the Democratic National Convention, which was not exactly a Wall Street lovefest, and one might say stocks glided through the week.
The S&P 500 took in what crossed the plate last week, digested it and closed last Friday at 2173.60, or just 0.07% below where it was when it reached its latest record high on the prior Friday.
The Dow 30 (the Dow Jones Industrial Average) fared not quite as well on the week, slipping 0.75% after two of its members, McDonald’s and ExxonMobil, reported results that disappointed. The Dow’s loss was ameliorated somewhat by gains in two other Dow members last week as shares of Apple and Caterpillar advanced despite relatively tough conditions countered by attractive valuations and future prospects.
Merger announcements provided some buoyancy last week, but it was the Fed’s FOMC meeting that really grabbed investor attention, and if only for around 24 hours had some investors thinking once again that the Fed just might raise rates as early as September.
The latter thought was pretty much dashed after the GDP number came out, and prospects for a Fed hike in September fell from 28% to 18%.
We’re reminded that too often investors jump the gun with projections of where the economy or the market is headed based on a single data point. Early reads on GDP quarterly growth are subject to revision in subsequent readings. We’ll hesitate to call the game on this first read of Q2 GDP.
Oil prices continued to fall last week with the price of WTI (West Texas Intermediate) ending July priced just under 14.5% from where it ended June. At $41.60 a barrel on Friday, WTI was off nearly 20% from its 2016 high of $51.23 on June 8th. Oil has fallen on concerns as supply has increased as well as on disappointing quarterly results and comments from a number of the major integrated oil companies this week..
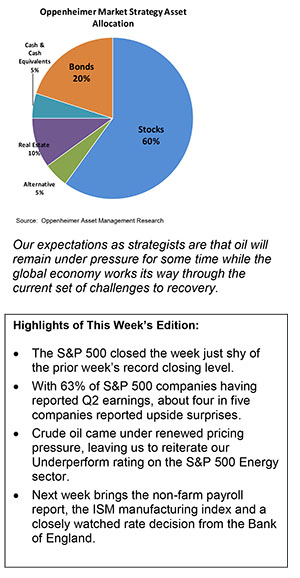
Our expectations as strategists are that oil will remain under pressure for some time while the global economy works its way through the current set of challenges to recovery.
For now global supply levels, sector overcapacity even with the considerable consolidation process that has already occurred, along with technology that boosts exploration, production and efficiencies of use lead us to believe that the sector will remain under pressure in the near to intermediate term. We reiterate our underweight weighting to the S&P 500 Energy sector at this time.
Investor attention is likely to be stoked this week with plenty of action culminating with the non-farm payroll number and the headline unemployment number on Friday. A Bloomberg survey of economists is calling for 175,000 jobs to have been added in July and headline unemployment dipping to 4.8%.
Highlights leading up to Friday include the ISM manufacturing index for July (Monday); Fed speak via the Dallas Fed President (Robert Kaplan) on Tuesday; a decision by Japan’s cabinet on Prime Minister Shinzo Abe’s stimulus package, also on Tuesday; the ADP employment data and the ISM non-manufacturing index for July on Wednesday; the Bank of England’s decision on interest rates on Thursday (expectations are for a cut in rates–the last time it cut rates was in 2009).
With a little more than a third of companies left to report Q2 results, the market will be weighing this week’s brace of economic data against Q2 earnings results seeking a catalyst for its next definitive move.
For the complete report, please contact your Oppenheimer Financial Advisor.
Other Disclosures
This report is issued and approved by Oppenheimer & Co. Inc., a member of all Principal Exchanges, and SIPC. This report is distributed by Oppenheimer & Co. Inc., for informational purposes only, to its institutional and retail investor clients. This report does not constitute an offer or solicitation to buy or sell any securities discussed herein in any jurisdiction where such offer or solicitation would be prohibited. The securities mentioned in this report may not be suitable for all types of investors. This report does not take into account the investment objectives, financial situation or specific needs of any particular client of Oppenheimer & Co. Inc. Recipients should consider this report as only a single factor in making an investment decision and should not rely solely on investment recommendations contained herein, if any, as a substitution for the exercise of independent judgment of the merits and risks of investments. The strategist writing this report is not a person or company with actual, implied or apparent authority to act on behalf of any issuer mentioned in the report. Before making an investment decision with respect to any security discussed in this report, the recipient should consider whether such investment is appropriate given the recipient's particular investment needs, objectives and financial circumstances. We recommend that investors independently evaluate particular investments and strategies, and encourage investors to seek the advice of a financial advisor. Oppenheimer & Co. Inc. will not treat non-client recipients as its clients solely by virtue of their receiving this report. Past performance is not a guarantee of future results, and no representation or warranty, express or implied, is made regarding future performance of any security mentioned in this report. The price of the securities mentioned in this report and the income they produce may fluctuate and/or be adversely affected by exchange rates, and investors may realize losses on investments in such securities, including the loss of investment principal.
Oppenheimer & Co. Inc. accepts no liability for any loss arising from the use of information contained in this report. All information, opinions and statistical data contained in this report were obtained or derived from public sources believed to be reliable, but Oppenheimer & Co. Inc. does not represent that any such information, opinion or statistical data is accurate or complete and they should not be relied upon as such. All estimates and opinions expressed herein constitute judgments as of the date of this report and are subject to change without notice. Nothing in this report constitutes legal, accounting or tax advice. Since the levels and bases of taxation can change, any reference in this report to the impact of taxation
INVESTMENT STRATEGY
should not be construed as offering tax advice on the tax consequences of investments. As with any investment having potential tax implications, clients should consult with their own independent tax adviser.
This report may provide addresses of, or contain hyperlinks to, Internet web sites. Oppenheimer & Co. Inc. has not reviewed the linked Internet web site of any third party and takes no responsibility for the contents thereof. Each such address or hyperlink is provided solely for the recipient's convenience and information, and the content of linked third party web sites is not in any way incorporated into this document. Recipients who choose to access such third-party web sites or follow such hyperlinks do so at their own risk. The S&P 500 Index is an unmanaged value-weighted index of 500 common stocks that is generally considered representative of the U.S. stock market. The S&P 500 index figures do not reflect any fees, expenses or taxes. This research is distributed in the UK and elsewhere throughout Europe, as third party research by Oppenheimer Europe Ltd, which is authorized and regulated by the Financial Conduct Authority (FCA). This research is for information purposes only and is not to be construed as a solicitation or an offer to purchase or sell investments or related financial instruments. This report is for distribution only to persons who are eligible counterparties or professional clients and is exempt from the general restrictions in section 21 of the Financial Services and Markets Act 2000 on the communication of invitations or inducements to engage in investment activity on the grounds that it is being distributed in the UK only to persons of a kind described in Article 19(5) (Investment Professionals) and 49(2) High Net Worth companies, unincorporated associations etc.) of the Financial Services and Markets Act 2000 (Financial Promotion) Order 2005 (as amended). It is not intended to be distributed or passed on, directly or indirectly, to any other class of persons. In particular, this material is not for distribution to, and should not be relied upon by, retail clients, as defined under the rules of the FCA. Neither the FCA’s protection rules nor compensation scheme may be applied. This report or any portion hereof may not be reprinted, sold, or redistributed without the written consent of Oppenheimer & Co. Inc. Copyright © Oppenheimer & Co. Inc. 2015.
