Everyday, Everyday I Have the Blues
By John Stoltzfus,
Chief Investment Strategist
Location, Location, Location
As in real estate, relative valuation is what counts
Last week the S&P 500 reached three new record highs, closing the week at 2,175.03, or 0.6% above where it started the week and just 5.7% below our 2016 target of 2,300 for the benchmark that we initiated near the end of the fourth quarter of last year.
Though last week’s gains appear modest, the benchmark as of last Friday was up 3.6% from the end of June and up 6.4% year to date.
Not too shabby we’d say, considering the challenges stocks have faced in 2016─from currency and commodity volatility, growth fears, worries about the direction of Fed policy, earnings declines, challenged revenue growth tied to dollar strength, Brexit and slow global growth.
Beyond those, the US presidential election year from primaries to conventions so far signals uncertainty not seen in a good number of election cycles, along with escalating domestic and geopolitical risk coming from populism, resurgent nationalism and terrorism.
Thus far it’s been an “everything but the kitchen sink” kind of year for the markets, and stocks have shown resilience in weathering the storms and climbing repetitive “walls of worry” higher.
With the US economic expansion showing sustainability by way of recent economic data on jobs, housing, retail sales and auto sales (still close to record levels), along with predictions from some economists that Q2 GDP could be as strong as 3% on its first read due this week, stocks may well continue to surprise and even taunt skeptics further into the late summer.
Thus far, Q2 earnings season has seen a good number of positive surprises in both earnings and revenues from companies reporting this earnings season. Admittedly, once again sell-side analysts had slashed earlier rosier forecasts ahead of earnings season, thereby lowering the bar.
That said, a positive surprise is a positive surprise, and beyond that the message from not a few companies reporting thus far indicates that while the environment remains challenging, discipline, creativity and innovation reward the standouts.
M&A remains a standard news item boosting stocks on the daily tape as trends of consolidation in the face of global overcapacity and lower barriers of entry to competitors in a myriad of businesses keep managements on their toes. Growth via strategic acquisitions, as well as managements that opt to grow via acquisition versus growing organically, all feed M&A.
Last week’s gains indicated to us that money that has been sidelined and kept out of equities since the Great Crisis may be nearing a point of capitulation as the eighth anniversary of what we call “near zero interest rate protocol” by monetary policy makers closes in on an eighth anniversary this December.
It was in December of 2008 amidst the financial crisis that the Fed cut its benchmark rate to the bone to a band range of 0% to 0.25%.
You can’t just wish interest rates higher
Every year thereafter in December it seemed to us that investors would look with anticipation to the New Year with expectation that somehow interest rates would move higher and something called “interest rate normalization” would lead to an economic cycle resembling those belonging to prior historical market cracks, troughs and recoveries. Those expectations have yet to be met as the economy and the markets grind higher toward a normal that has yet to arrive.
From early May of 2013 bond yields jumped on expectations that Fed tapering of its bond buying program would lead to a quick normalization of yields. The bond market pushed the US Treasury 10-year yield from 1.63% on May 2nd to 3.03% by the last day of 2013.
In 2014 when the tapering actually took place, the yield on the 10-year Treasury fell from the December 2013 peak to 2.2% by the end of 2014 after trading as low as 2.06% in mid-December of that year. There simply was not enough inflation to justify the higher yields seen in 2013.
The 10-year Treasury yield ended the week last Friday at 1.56%, up from a record closing low of 1.36% achieved on July 8th of this year.
Is that all there is?
With the US 10-year Treasury yield around these levels and with economic growth as good as it is relative to the challenges outstanding on the landscape at home and abroad, equities stateside may have room to move higher from here as sidelined money awakens to the possibility that higher yields─the type of interest rates that investors seek for current income and goal-oriented needs─may remain scarce in the fixed income space for even longer than they expected.
That said, markets tend not to move up in straight lines uninterrupted.
With the VIX closing last Friday at 12.02 and just slightly higher than where it stood on July 20th, we’d have to think it’s only a matter of time before the market starts looking for a catalyst to take some profits or trim the sails.
We’re not battening down the hatches or looking for a precipitous decline, but a short breather would not take us by surprise. At 12.02 the VIX is 70.5% lower than where it stood last August, when it spiked after the Chinese currency devaluation, and 30.7% below its five-year average level.
A little profit-taking amongst sectors (think defensives) that have run up especially strong this year might be called for.
Tweaking Our Earnings Estimate
We are revising lower our expectations for S&P 500 earnings in 2016.
We reduce our 2016 annual earnings forecast from $129 per share to $124 per share to reflect:
These factors, along with a resurgent post-Brexit US dollar, are likely to restrain earnings growth in the quarters that remain this year.
We still expect the benchmark to reach 2,300 by year-end, implying a P/E multiple of 18.6x on our adjusted earnings growth expectation of $124 per share.
We look for price/earnings multiple expansion to play a larger role in pushing the index price higher.
We believe that investors finding themselves nearing an eighth anniversary (in December) of the near zero interest rate protocol by the Federal Reserve (and other central banks around the world) will become less reticent in their view of equity ownership in light of fixed income yields that are near or at historical lows.
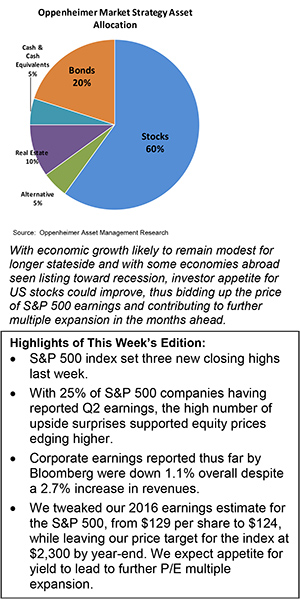
With economic growth likely to remain modest for longer stateside (running at a projected rate of 1.9% to 2.5% annually) and with some economies abroad seen listing toward recession, domestic and international investors’ appetite for US stocks could improve, thus bidding up the price of S&P 500 earnings and contributing to further multiple expansion in the months ahead.
For the complete report, please contact your Oppenheimer Financial Advisor.
Other Disclosures
This report is issued and approved by Oppenheimer & Co. Inc., a member of all Principal Exchanges, and SIPC. This report is distributed by Oppenheimer & Co. Inc., for informational purposes only, to its institutional and retail investor clients. This report does not constitute an offer or solicitation to buy or sell any securities discussed herein in any jurisdiction where such offer or solicitation would be prohibited. The securities mentioned in this report may not be suitable for all types of investors. This report does not take into account the investment objectives, financial situation or specific needs of any particular client of Oppenheimer & Co. Inc. Recipients should consider this report as only a single factor in making an investment decision and should not rely solely on investment recommendations contained herein, if any, as a substitution for the exercise of independent judgment of the merits and risks of investments. The strategist writing this report is not a person or company with actual, implied or apparent authority to act on behalf of any issuer mentioned in the report. Before making an investment decision with respect to any security discussed in this report, the recipient should consider whether such investment is appropriate given the recipient's particular investment needs, objectives and financial circumstances. We recommend that investors independently evaluate particular investments and strategies, and encourage investors to seek the advice of a financial advisor. Oppenheimer & Co. Inc. will not treat non-client recipients as its clients solely by virtue of their receiving this report. Past performance is not a guarantee of future results, and no representation or warranty, express or implied, is made regarding future performance of any security mentioned in this report. The price of the securities mentioned in this report and the income they produce may fluctuate and/or be adversely affected by exchange rates, and investors may realize losses on investments in such securities, including the loss of investment principal.
Oppenheimer & Co. Inc. accepts no liability for any loss arising from the use of information contained in this report. All information, opinions and statistical data contained in this report were obtained or derived from public sources believed to be reliable, but Oppenheimer & Co. Inc. does not represent that any such information, opinion or statistical data is accurate or complete and they should not be relied upon as such. All estimates and opinions expressed herein constitute judgments as of the date of this report and are subject to change without notice. Nothing in this report constitutes legal, accounting or tax advice. Since the levels and bases of taxation can change, any reference in this report to the impact of taxation
INVESTMENT STRATEGY
should not be construed as offering tax advice on the tax consequences of investments. As with any investment having potential tax implications, clients should consult with their own independent tax adviser.
This report may provide addresses of, or contain hyperlinks to, Internet web sites. Oppenheimer & Co. Inc. has not reviewed the linked Internet web site of any third party and takes no responsibility for the contents thereof. Each such address or hyperlink is provided solely for the recipient's convenience and information, and the content of linked third party web sites is not in any way incorporated into this document. Recipients who choose to access such third-party web sites or follow such hyperlinks do so at their own risk. The S&P 500 Index is an unmanaged value-weighted index of 500 common stocks that is generally considered representative of the U.S. stock market. The S&P 500 index figures do not reflect any fees, expenses or taxes. This research is distributed in the UK and elsewhere throughout Europe, as third party research by Oppenheimer Europe Ltd, which is authorized and regulated by the Financial Conduct Authority (FCA). This research is for information purposes only and is not to be construed as a solicitation or an offer to purchase or sell investments or related financial instruments. This report is for distribution only to persons who are eligible counterparties or professional clients and is exempt from the general restrictions in section 21 of the Financial Services and Markets Act 2000 on the communication of invitations or inducements to engage in investment activity on the grounds that it is being distributed in the UK only to persons of a kind described in Article 19(5) (Investment Professionals) and 49(2) High Net Worth companies, unincorporated associations etc.) of the Financial Services and Markets Act 2000 (Financial Promotion) Order 2005 (as amended). It is not intended to be distributed or passed on, directly or indirectly, to any other class of persons. In particular, this material is not for distribution to, and should not be relied upon by, retail clients, as defined under the rules of the FCA. Neither the FCA’s protection rules nor compensation scheme may be applied. This report or any portion hereof may not be reprinted, sold, or redistributed without the written consent of Oppenheimer & Co. Inc. Copyright © Oppenheimer & Co. Inc. 2015.
