Everyday, Everyday I Have the Blues
By John Stoltzfus,
Chief Investment Strategist
Break on Through to the Other Side
We quote Jim Morrison as the broad US market posted new record highs last week
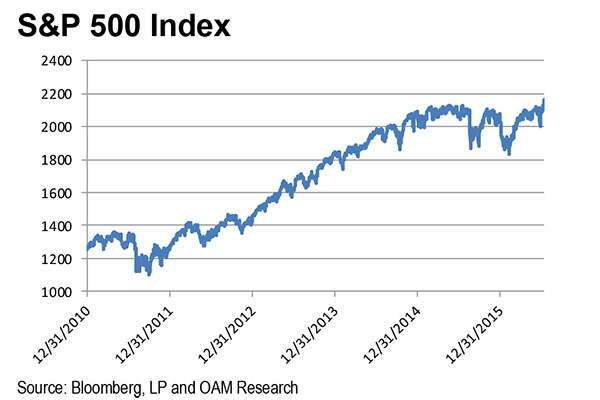
Last week saw the S&P 500 post four successive new record highs from the start of the week through Thursday before closing slightly lower on Friday.
Contrary to the spin some bearish types tried to put on last week’s rather modest move higher, there weren’t any animal spirits powering the moves higher that we could see, nor was there a sense of anything near “irrational exuberance” in the vicinity of the markets from what we could tell.
Instead, the market managed to grind higher four days in a row on back of improving economic data (and several better than expected Q2 earnings results) after nearly 14 months of trying to “break on through to the other side” to get above the May 21, 2015 record level of 2130.82.
Last week’s record highs on the S&P 500 were reached via modest respective daily gains of 0.34%, 0.7%, 0.01% and 0.53% from Monday through Thursday. Friday’s give-back was slight with the S&P 500 slipping just 0.09%.
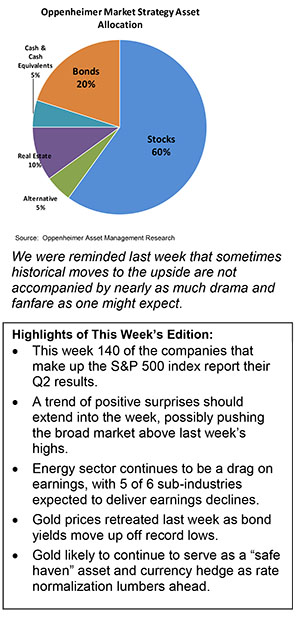
We were reminded last week that sometimes historical moves to the upside are not accompanied by nearly as much drama and fanfare as one might expect.
The week ahead could see some testing of the new levels reached last week as 140 of the S&P 500 companies report results in this second week of Q2 earnings season and as the markets sort out the effects of rising geopolitical tensions, national security risks, as well as the start of the Republican National Convention in Cleveland on Monday.
With some 7% or 35 of the companies in the S&P 500 having thus far reported earnings to date for Q2, FactSet data shows that 66% have reported earnings above the mean estimate and 51% have reported sales above the mean estimate.
For Q2 2016, the blended (actual reported and the estimate for those yet reported) expected earnings decline stands at -5.5%. If the index earnings decline for Q2, it will be the first time the index has recorded five consecutive quarters of year-overyear declines in earnings since Q3 2008 through Q3 2009.
Per FactSet, four S&P 500 sectors are reporting or are expected to report year-over-year earnings growth this season, led by Information Technology, Telecom Services and Consumer Discretionary.
Six sectors are reporting or are expected to report a year-over-year decline in earnings, led by Energy, Materials and Information Technology.
For yet another quarter the Energy sector is expected to be the biggest drag on earnings for the S&P 500 with analysts surveyed by FactSet looking for the sector to show the largest year-overyear decline in earnings (-77.7%) of all ten sectors. Of the sector’s six sub-industries five are projected to report a year-over-year decrease in earnings.
If the Energy sector’s results were to be excluded, it’s expected that the estimated earnings decline for the S&P 500 would -2.0% instead of -5.5%.
S&P 500 revenues are expected to decline with the blended sales decline for Q2 2016 at -0.6%, somewhat less than the estimated sales decline of -0.8% at the end of the second quarter.
Six sectors are reporting or are projected to report year-over-year growth in revenues, led by the Telecom Services and Health Care sectors.
Four sectors are reporting or are predicted to report a year-over-year decline in revenues, led by the Energy sector and the Materials sector.
Among the pressing issues of the day one would expect to be mentioned in corporate conference calls this reporting season (including Brexit, oil prices, currency, interest rates, monetary policy, terrorism and the US presidential election) foreign exchange (currency) ranks highest so far (mentioned in 21 of some 35 calls tracked by FactSet).
“Brexit” (or “UK referendum”) was specified by ten of the S&P 500 companies (nearly a third) during earnings conference calls so far. As of last week neither “zika” nor “terrorism” were mentioned during the calls.
Other macro items highlighted in this Q2 earnings season in S&P 500 conference calls so far have been “interest rates,” “wages” and “Brazil.”
Since the start of the year emerging markets have garnered favor with investors seeking diversification from developed markets whose valuations have moved substantially higher from their lows this year.
Investors moved $1.3 billion into an exchangetraded fund that tracks the MSCI Emerging Markets Index in last week’s risk-on rally. The move on July 14th was the biggest single-day inflow into the ETF traded in the US since April 7, 2014, according to Bloomberg.
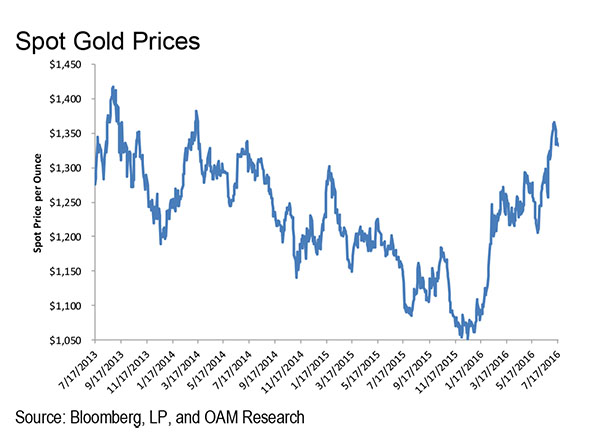
The precious metal came off its recent highs last week, slipping 2.1% on the week as economic data pointed to a sustainable economic recovery in the US and investors’ consideration of the possibility that the Federal Reserve could find justification to lift rates this year.
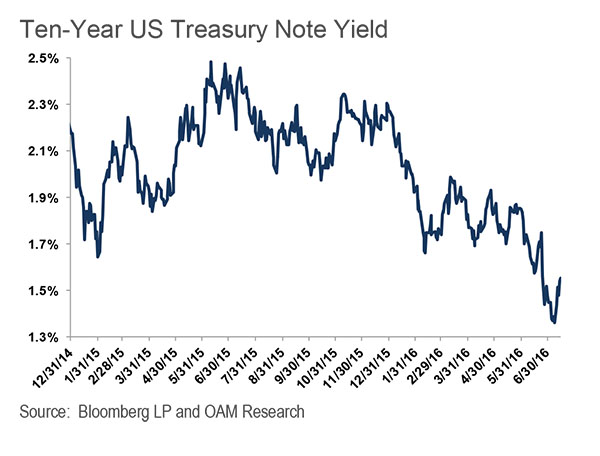
Holdings in ETFs backed by bullion showed their first weekly loss since the end of May as hedge funds and speculators cut their exposure to the shiny stuff as bond prices moved lower and yields rose with the 10-year Treasury note yield at 1.55% from a historical low of 1.36% on the prior Friday (see figure below).
As the process of rate normalization lumbers ahead and the world turns:
Global and domestic risks on the horizon tied to monetary policy, to election risk and a host of other day-to-day digital and analog headline risks suggest to us that gold will continue to serve a purpose for investors and traders who favor the metal as a hedge against these factors. Such favor could keep the metal trading in a range from $1,100 to as high as $1,450 for the foreseeable future.
For the complete report, please contact your Oppenheimer Financial Advisor.
Other Disclosures
This report is issued and approved by Oppenheimer & Co. Inc., a member of all Principal Exchanges, and SIPC. This report is distributed by Oppenheimer & Co. Inc., for informational purposes only, to its institutional and retail investor clients. This report does not constitute an offer or solicitation to buy or sell any securities discussed herein in any jurisdiction where such offer or solicitation would be prohibited. The securities mentioned in this report may not be suitable for all types of investors. This report does not take into account the investment objectives, financial situation or specific needs of any particular client of Oppenheimer & Co. Inc. Recipients should consider this report as only a single factor in making an investment decision and should not rely solely on investment recommendations contained herein, if any, as a substitution for the exercise of independent judgment of the merits and risks of investments. The strategist writing this report is not a person or company with actual, implied or apparent authority to act on behalf of any issuer mentioned in the report. Before making an investment decision with respect to any security discussed in this report, the recipient should consider whether such investment is appropriate given the recipient's particular investment needs, objectives and financial circumstances. We recommend that investors independently evaluate particular investments and strategies, and encourage investors to seek the advice of a financial advisor. Oppenheimer & Co. Inc. will not treat non-client recipients as its clients solely by virtue of their receiving this report. Past performance is not a guarantee of future results, and no representation or warranty, express or implied, is made regarding future performance of any security mentioned in this report. The price of the securities mentioned in this report and the income they produce may fluctuate and/or be adversely affected by exchange rates, and investors may realize losses on investments in such securities, including the loss of investment principal.
Oppenheimer & Co. Inc. accepts no liability for any loss arising from the use of information contained in this report. All information, opinions and statistical data contained in this report were obtained or derived from public sources believed to be reliable, but Oppenheimer & Co. Inc. does not represent that any such information, opinion or statistical data is accurate or complete and they should not be relied upon as such. All estimates and opinions expressed herein constitute judgments as of the date of this report and are subject to change without notice. Nothing in this report constitutes legal, accounting or tax advice. Since the levels and bases of taxation can change, any reference in this report to the impact of taxation
INVESTMENT STRATEGY
should not be construed as offering tax advice on the tax consequences of investments. As with any investment having potential tax implications, clients should consult with their own independent tax adviser.
This report may provide addresses of, or contain hyperlinks to, Internet web sites. Oppenheimer & Co. Inc. has not reviewed the linked Internet web site of any third party and takes no responsibility for the contents thereof. Each such address or hyperlink is provided solely for the recipient's convenience and information, and the content of linked third party web sites is not in any way incorporated into this document. Recipients who choose to access such third-party web sites or follow such hyperlinks do so at their own risk. The S&P 500 Index is an unmanaged value-weighted index of 500 common stocks that is generally considered representative of the U.S. stock market. The S&P 500 index figures do not reflect any fees, expenses or taxes. This research is distributed in the UK and elsewhere throughout Europe, as third party research by Oppenheimer Europe Ltd, which is authorized and regulated by the Financial Conduct Authority (FCA). This research is for information purposes only and is not to be construed as a solicitation or an offer to purchase or sell investments or related financial instruments. This report is for distribution only to persons who are eligible counterparties or professional clients and is exempt from the general restrictions in section 21 of the Financial Services and Markets Act 2000 on the communication of invitations or inducements to engage in investment activity on the grounds that it is being distributed in the UK only to persons of a kind described in Article 19(5) (Investment Professionals) and 49(2) High Net Worth companies, unincorporated associations etc.) of the Financial Services and Markets Act 2000 (Financial Promotion) Order 2005 (as amended). It is not intended to be distributed or passed on, directly or indirectly, to any other class of persons. In particular, this material is not for distribution to, and should not be relied upon by, retail clients, as defined under the rules of the FCA. Neither the FCA’s protection rules nor compensation scheme may be applied. This report or any portion hereof may not be reprinted, sold, or redistributed without the written consent of Oppenheimer & Co. Inc. Copyright © Oppenheimer & Co. Inc. 2015.
