Everyday, Everyday I Have the Blues
By John Stoltzfus,
Chief Investment Strategist
Trading Places – Revisited
Stock rally stalled as investors turned to bonds and gold
Stateside investors were reminded of the global markets’ interdependence last week as the concept of decoupling was once again debunked along the road to normalization.
A rally in stocks that began on May 19th took stocks to an intra-day level of 2,120.55 last Wednesday--within less than a half a percent of the S&P 500’s all-time high of 2130.82 reached last year--ran across a series of speed bumps in the shape of familiar concerns that ranged from:

All of the above moved some investors to consider moving back to a “risk off” stance, which they did over the last two days of last week.
Stocks had led the other asset classes in a rally that began on May 19th and had carried the S&P 500 up some 3.88% through last week when stocks changed direction.
Asset classes traded places last week as stocks hit the series of speed bumps mentioned above causing them to take a detour from their recent path and to take a trim (if not a haircut), giving way to a rally in bonds which took the 10-year yield from 1.74% on Monday to 1.62% by Friday and bumped the price of gold 2.4% higher on the week.
A focal point of the worries dogging the markets of late has been that $10 trillion of debt worldwide is at negative yield.
Among major developed countries the 10-year yields of government debt in Germany, Switzerland and Japan last week were at ‑0.02%, ‑0.50% and ‑0.17% respectively.
As is well known, bond purchases initiated by monetary policy makers in Europe and Japan (in their respective efforts to combat deflation) have driven prices of a wide array of fixed income securities higher. At the same time the thirst for yield among investors, particularly in those countries experiencing negative yields, has grown greater-- pushing yields lower and compounding the problems created by abnormally low interest rates.
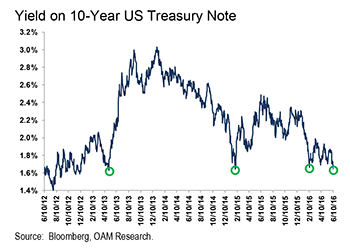
U.S. Treasury yields, which are comparatively rich to other developed country yields, have attracted foreign fund flows from foreign investors looking to quench their thirst for yield, pushing the U.S. 10-year Treasury’s yield down to 1.625% last Friday.
Investors stateside last week feared that Friday’s low yield on the 10-year Treasury might also be signaling further economic slowing or even a recession ahead.
In our opinion, the last concern is unfounded. While the latest non-farm payroll shocked and awed with its disappointing jobs number (+38,000 in May, compared to +160,000 expected), other economic data released in the days prior and since do not support the amount of negative projection that some investors have ascribed to the May non-farm payroll number.
Consider the Labor Department’s “JOLTS” data (Jobs Openings and Labor Turnover Survey), which last week was at its second highest level since the measure was created in 2000. We’d also point to initial jobless claims, which have been at record low levels for the last 66 weeks, positive housing data, consumer confidence, and wage growth (among others).
Beyond the economic data, which in our view continues broadly to signal that the current US expansion is sustainable (albeit at a moderate pace), we would also note that while a 1.6% yield on the U.S. 10-year note justifiably warrants investors’ attention, we’d posit that at previous points on the economic recovery and expansion time line when we’ve seen such low yields on the 10-year, this has not proved to be damaging to subsequent market performance.

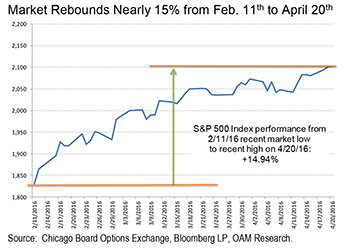
Consider that the 10-year’s yield fell to around last Friday’s level as recently as February 11th of this year (1.66%) just before the S&P 500 began a rally that drove the broad market up nearly 15% through April 20th (see figure below).

Prior to that, we’d seen a yield of 1.6% on the 10-year Treasury on January 30th, 2015 after “another growth scare” (see Treasury Yield graph above). The S&P 500 rose 6.7% from January 30th through July 20th of that year.
Before that the 10-year yield was at 1.6% on May 1, 2013 around the time that Ben Bernanke, then Chairman of the Federal Reserve, announced that the Fed might consider “tapering” its monthly bond buying program. The S&P 500 rallied some 16.8% from May 1, 2013 through the end of that year.
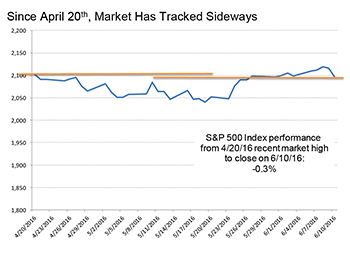
The major indexes that had enjoyed the benefit of their latest rally that began on April 20th slipped lower in the latter part of last week with the S&P 500, the S&P 400 and the Russell 2000 respectively shedding 0.15%, 0.12% and 0.02% (see figure below).

Outside of the US, developed markets were more challenged with MSCI EAFE (developed markets ex-US and Canada) and the MSCI Emerging markets falling respectively 1.8%, and 0.94%. The Frontier markets fared better, easing lower just 0.10% on the week.
We believe what really matters to the market stateside in the weeks ahead will be signs of continued economic growth and the results and guidance that come out of Q2 earnings season (which will unofficially begin on July 11th when Alcoa reports).
The rally in the price of oil reflected in the energy sector and the effects of a lower dollar on revenues and earnings for multinationals in the S&P 500 could well serve to push stock prices higher over the summer.
For now we recommend that investors selectively overweight cyclicals versus defensive sectors, remain overweight US equities with a market cap agnostic view and avoid value traps as they seek cyclical companies that pay dividend income and offer prospects for capital appreciation.
Particularly noteworthy to globalist investors this week:
MSCI will announce its decision on June 14th on whether China’s yuan-denominated A-shares will be added to its indices.
If MSCI chooses to include these issues, they are expected to attract billions of dollars in inflows over the course of time into the Chinese bourses and give support to a market that’s been one of the world’s worst performers so far this year.
Since 2013 MSCI has formally insisted that improvements in China related to market accessibility would be needed for inclusion in the major emerging market indices.
Currently most investors outside China access Chinese companies via listings in Hong Kong, or as GDRs, ordinary shares and direct listings on foreign exchanges.
Barron’s reports this week that inclusion of the A- shares into the MSCI indices would be gradual and take place over several years.
MSCI Indexes would at first likely assign A-shares a 1.1% weighting in the MSCI Emerging Markets Index as reflected in ETF trackers.
Barron’s reported that Credit Suisse estimates that the weight would grow over time to around 18% of the benchmark once fully included.
For now, the decision and scope of the MSCI decision this week will be anticipated greatly by investors since reclassification of such a constituency is expected to trigger significant levels of purchases and sales to accommodate the change.
Other index sponsors have already begun the process including FTSE Russell and their partner the Vanguard Group, which began to add them at the end of last year to their respective emerging market indices and ETFs. Vanguard has said that it anticipates that around 6% of its emerging-market stock portfolio will include China A-shares by the end of this year.
Stateside, the Fed’s FOMC announces its decision on interest rates Wednesday at 2:00pm EDT.
Late Sunday night, futures indicated a 0.0% probability of a Fed hike this week.
Stay tuned.
For the complete report, please contact your Oppenheimer Financial Advisor.
Other Disclosures
This report is issued and approved by Oppenheimer & Co. Inc., a member of all Principal Exchanges, and SIPC. This report is distributed by Oppenheimer & Co. Inc., for informational purposes only, to its institutional and retail investor clients. This report does not constitute an offer or solicitation to buy or sell any securities discussed herein in any jurisdiction where such offer or solicitation would be prohibited. The securities mentioned in this report may not be suitable for all types of investors. This report does not take into account the investment objectives, financial situation or specific needs of any particular client of Oppenheimer & Co. Inc. Recipients should consider this report as only a single factor in making an investment decision and should not rely solely on investment recommendations contained herein, if any, as a substitution for the exercise of independent judgment of the merits and risks of investments. The strategist writing this report is not a person or company with actual, implied or apparent authority to act on behalf of any issuer mentioned in the report. Before making an investment decision with respect to any security discussed in this report, the recipient should consider whether such investment is appropriate given the recipient's particular investment needs, objectives and financial circumstances. We recommend that investors independently evaluate particular investments and strategies, and encourage investors to seek the advice of a financial advisor. Oppenheimer & Co. Inc. will not treat non-client recipients as its clients solely by virtue of their receiving this report. Past performance is not a guarantee of future results, and no representation or warranty, express or implied, is made regarding future performance of any security mentioned in this report. The price of the securities mentioned in this report and the income they produce may fluctuate and/or be adversely affected by exchange rates, and investors may realize losses on investments in such securities, including the loss of investment principal.
Oppenheimer & Co. Inc. accepts no liability for any loss arising from the use of information contained in this report. All information, opinions and statistical data contained in this report were obtained or derived from public sources believed to be reliable, but Oppenheimer & Co. Inc. does not represent that any such information, opinion or statistical data is accurate or complete and they should not be relied upon as such. All estimates and opinions expressed herein constitute judgments as of the date of this report and are subject to change without notice. Nothing in this report constitutes legal, accounting or tax advice. Since the levels and bases of taxation can change, any reference in this report to the impact of taxation
INVESTMENT STRATEGY
should not be construed as offering tax advice on the tax consequences of investments. As with any investment having potential tax implications, clients should consult with their own independent tax adviser.
This report may provide addresses of, or contain hyperlinks to, Internet web sites. Oppenheimer & Co. Inc. has not reviewed the linked Internet web site of any third party and takes no responsibility for the contents thereof. Each such address or hyperlink is provided solely for the recipient's convenience and information, and the content of linked third party web sites is not in any way incorporated into this document. Recipients who choose to access such third-party web sites or follow such hyperlinks do so at their own risk. The S&P 500 Index is an unmanaged value-weighted index of 500 common stocks that is generally considered representative of the U.S. stock market. The S&P 500 index figures do not reflect any fees, expenses or taxes. This research is distributed in the UK and elsewhere throughout Europe, as third party research by Oppenheimer Europe Ltd, which is authorized and regulated by the Financial Conduct Authority (FCA). This research is for information purposes only and is not to be construed as a solicitation or an offer to purchase or sell investments or related financial instruments. This report is for distribution only to persons who are eligible counterparties or professional clients and is exempt from the general restrictions in section 21 of the Financial Services and Markets Act 2000 on the communication of invitations or inducements to engage in investment activity on the grounds that it is being distributed in the UK only to persons of a kind described in Article 19(5) (Investment Professionals) and 49(2) High Net Worth companies, unincorporated associations etc.) of the Financial Services and Markets Act 2000 (Financial Promotion) Order 2005 (as amended). It is not intended to be distributed or passed on, directly or indirectly, to any other class of persons. In particular, this material is not for distribution to, and should not be relied upon by, retail clients, as defined under the rules of the FCA. Neither the FCA’s protection rules nor compensation scheme may be applied. This report or any portion hereof may not be reprinted, sold, or redistributed without the written consent of Oppenheimer & Co. Inc. Copyright © Oppenheimer & Co. Inc. 2015.