Everyday, Everyday I Have the Blues
By John Stoltzfus,
Chief Investment Strategist
Keeping Things in Perspective
Also means keeping expectations right-sized
Of the three major market capitalization indices, the S&P 500 reached its peak for the year so far on April 20th while the S&P 400 and the Russell 2000 ran higher a week further (to April 27) to arrive at their respective highs for the year to date.
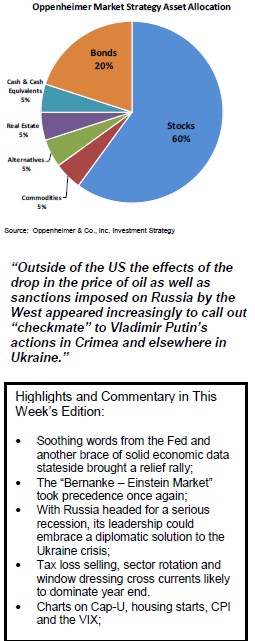
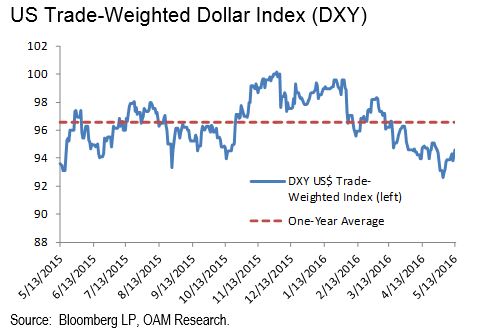
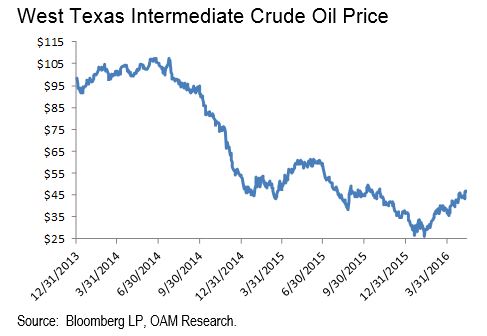
A combination of a resurgence in dollar strength, volatility in the prices of oil and other commodities, declines in bond yields along with a Q1 earnings season that is poised to deliver negative earnings growth for a fourth consecutive quarter have curbed the market enthusiasm that drove a powerful equity rally from mid-February through most of April.
Typical of market retracements that we have witnessed over the last 7.5 years, since 2009, questions as to the longevity of the great recovery bull market in stocks are on the rise. This comes as no surprise to us.
Over the course of the economic and market recovery through the current expansion we have learned to practice discipline to avoid:
It’s not about “late cycle slowing,” which in our opinion has too often been ascribed to periods of interim slowing over the last few years.
Instead periods of sluggishness that have emerged intermittently over the last 7-plus years seem in our view more illustrative of mid-cycle slowdown in an economy prone to slow growth. This was caused initially by the magnitude of the financial and housing crisis and more recently challenged by slow wage growth (the latest reported at around 2.5% y-o-y) in large part driven by a major technological transition in the workplace that is driven by algorithms and robotics aligned with the process of secular globalization.
As a result of these trends the process of wage reflation that typically occurs in a post-recovery economic expansion is not taking place.
The upshot is a monetary policy that remains highly accommodative (some would say too much so) stateside and abroad to stimulate growth in lieu of more robust wage growth.
In such an environment it is hard to see official interest rates rising in such a way as to potentially risk a Fed rate hike mistake that would push the economy back toward recession. For now at least accommodative monetary policy remains the order of the day and the time line for the process of interest rate normalization appears extended.
For now we suggest investors stay focused on their objectives, remain patient, and keep observant while the economy and the markets seek out their next catalyst from which to garner direction and traction.
The adage to “know what you own and why you own it,” along with having an idea of how one’s portfolio is likely to perform in various scenarios applies well to the current environment.
Cyclical stocks with managements that foster dividend policies supported by strong cash flow appear the most attractive at this juncture. Improved performance this year in value stocks signals to us the attractiveness of a barbell approach that gains exposure to value stocks as well as to enough growth opportunities to provide current income with the potential for capital appreciation.
In the near term the economy and market are likely to produce sequences like those last week wherein progress remains mixed as some segments of the economy find tailwind and others face headwinds.
Consider that just last week:
During previous periods of interim slowing that have occurred since the recovery process began stateside in the Spring of 2009 we have often found that after a growth scare appears on the landscape some piece of economic data (or an aggregate of data points that are decidedly positive) will cross the proverbial transom to overwhelm the angst and worry that grips the market.
Turnaround sources have included an upward revision to economic data or a decidedly improved sequential data point that “turns the beat around” boosting sentiment from negative to positive in a relatively short period of time.
Volatility inherent in data is widely recognized in retrospect though not much remembered in the drama of the moment of a bad report.
A change for the better whether coming from the non-farm payroll number, initial jobless claims, auto sales, housing, ISM purchasing managers index or to a lesser extent durable goods and industrial production (likely because those gauges represents a smaller portion of the economy than that related to the consumer) can turn market sentiment pretty much on a dime.
Much like the posse that saves the besieged “good guys” in a classic western, a virtual “posse of positive economic data” has over the last few years none too infrequently chased fears off the investment landscape in fairly quick fashion.
Stay tuned.
For the complete report, please contact your Oppenheimer Financial Advisor.
Other Disclosures
This report is issued and approved by Oppenheimer & Co. Inc., a member of all Principal Exchanges, and SIPC. This report is distributed by Oppenheimer & Co. Inc., for informational purposes only, to its institutional and retail investor clients. This report does not constitute an offer or solicitation to buy or sell any securities discussed herein in any jurisdiction where such offer or solicitation would be prohibited. The securities mentioned in this report may not be suitable for all types of investors. This report does not take into account the investment objectives, financial situation or specific needs of any particular client of Oppenheimer & Co. Inc. Recipients should consider this report as only a single factor in making an investment decision and should not rely solely on investment recommendations contained herein, if any, as a substitution for the exercise of independent judgment of the merits and risks of investments. The strategist writing this report is not a person or company with actual, implied or apparent authority to act on behalf of any issuer mentioned in the report. Before making an investment decision with respect to any security discussed in this report, the recipient should consider whether such investment is appropriate given the recipient's particular investment needs, objectives and financial circumstances. We recommend that investors independently evaluate particular investments and strategies, and encourage investors to seek the advice of a financial advisor. Oppenheimer & Co. Inc. will not treat non-client recipients as its clients solely by virtue of their receiving this report. Past performance is not a guarantee of future results, and no representation or warranty, express or implied, is made regarding future performance of any security mentioned in this report. The price of the securities mentioned in this report and the income they produce may fluctuate and/or be adversely affected by exchange rates, and investors may realize losses on investments in such securities, including the loss of investment principal.
Oppenheimer & Co. Inc. accepts no liability for any loss arising from the use of information contained in this report. All information, opinions and statistical data contained in this report were obtained or derived from public sources believed to be reliable, but Oppenheimer & Co. Inc. does not represent that any such information, opinion or statistical data is accurate or complete and they should not be relied upon as such. All estimates and opinions expressed herein constitute judgments as of the date of this report and are subject to change without notice. Nothing in this report constitutes legal, accounting or tax advice. Since the levels and bases of taxation can change, any reference in this report to the impact of taxation
INVESTMENT STRATEGY
should not be construed as offering tax advice on the tax consequences of investments. As with any investment having potential tax implications, clients should consult with their own independent tax adviser.
This report may provide addresses of, or contain hyperlinks to, Internet web sites. Oppenheimer & Co. Inc. has not reviewed the linked Internet web site of any third party and takes no responsibility for the contents thereof. Each such address or hyperlink is provided solely for the recipient's convenience and information, and the content of linked third party web sites is not in any way incorporated into this document. Recipients who choose to access such third-party web sites or follow such hyperlinks do so at their own risk. The S&P 500 Index is an unmanaged value-weighted index of 500 common stocks that is generally considered representative of the U.S. stock market. The S&P 500 index figures do not reflect any fees, expenses or taxes. This research is distributed in the UK and elsewhere throughout Europe, as third party research by Oppenheimer Europe Ltd, which is authorized and regulated by the Financial Conduct Authority (FCA). This research is for information purposes only and is not to be construed as a solicitation or an offer to purchase or sell investments or related financial instruments. This report is for distribution only to persons who are eligible counterparties or professional clients and is exempt from the general restrictions in section 21 of the Financial Services and Markets Act 2000 on the communication of invitations or inducements to engage in investment activity on the grounds that it is being distributed in the UK only to persons of a kind described in Article 19(5) (Investment Professionals) and 49(2) High Net Worth companies, unincorporated associations etc.) of the Financial Services and Markets Act 2000 (Financial Promotion) Order 2005 (as amended). It is not intended to be distributed or passed on, directly or indirectly, to any other class of persons. In particular, this material is not for distribution to, and should not be relied upon by, retail clients, as defined under the rules of the FCA. Neither the FCA’s protection rules nor compensation scheme may be applied. This report or any portion hereof may not be reprinted, sold, or redistributed without the written consent of Oppenheimer & Co. Inc. Copyright © Oppenheimer & Co. Inc. 2015.
