Everyday, Everyday I Have the Blues
By John Stoltzfus,
Chief Investment Strategist
I Want to Take you Higher
We quote Sly and the Family Stone as the stock market resumes its ascent of the Wall of Worry
As the calendar turns to the month of May we can’t help but remark that from our perspective on the radar screen we’ve heard a dearth of the usual springtime calls around the market place to “sell in May and go away”, even as the last trading session in April came to a close.
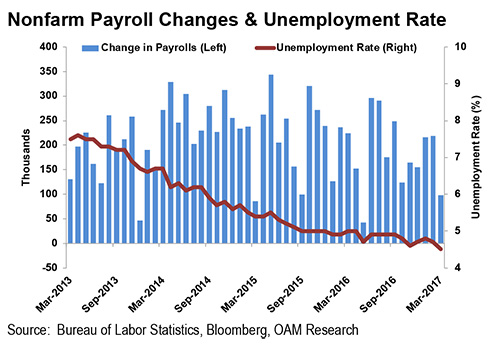
Could it be that a weak first pass at GDP growth reported for the first quarter and the disappointing March non-farm payroll number had so captured the attention of investors ardently looking for a catalyst for an equity pullback that they forgot to pay homage to the time-worn adage? We may never know, but its absence to be noted in annual and near traditional “over-kill fashion” caught our attention.
However, investors will likely pay considerable attention to the April non-farm payroll number which is scheduled to be released this Friday. Bloomberg’s survey of economist expectations looks for 190,000 jobs to have been added in April or better than double the March non-farm payroll gain of 98,000 (see figure below).
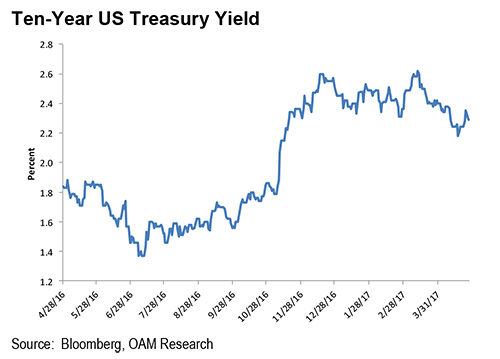
A second negative surprise on the non-farm payroll number could serve as a speed bump for the stock market that has delivered the goods so far, climbing a proverbial wall of worry laden with political risks (related to the progress, or lack thereof, of the new administration’s agenda items); geopolitical risks (North Korea, Syria, French elections among others) along with concerns that first quarter economic softness and a drop in the 10-year Treasury bond yield could signal something worse than a “first quarter malaise” that the economy has seemed to suffer with some frequency since the recovery from the Great Recession.
Also this week, the Federal Reserve’s FOMC meeting takes place as Fed futures indicate little chance expected for a policy move.
For now we’d venture that for all the concern emanating from some corners of the market with regard to valuations and economic strength, the recent direction lower in longer term interest rates (running counter to the direction of the Fed’s normalization commitment), has thus far been offset by economic data that broadly shows that economic growth persists—if at a too modest pace for the impatient—and at a good enough rate to signal sustainability of the current expansion.
Q1 earnings season with around 57% of S&P 500 companies having thus far reported shows earnings up over 15.5% and revenues (sales) up around 8%. Of course the improvement in overall earnings results for the S&P 500 thus far is in good part attributable to the positive turnaround in earnings in the energy sector in the latest quarter.
That notwithstanding, earnings growth and revenues reported thus far among most of the other sectors has provided results which show positive earnings growth in nine of the S&P 500’s 11 sectors.
The sectors with the best earnings thus far include: energy, materials, health care, financials, technology and real estate. Only the telecom sector has posted overall negative earnings growth. (See page 3 of this report for details of Q1 revenues, earnings and surprises through last week).
For all the talk about the “Trump Bump” being over or even dead, as of last Friday’s close the Dow Jones Industrial average, the S&P 500, the S&P 400 (Mid-Caps), the Russell 2000 (small caps) and the Nasdaq composite (with around 42% technology stocks) stood 14.2%, 11.4%, 14.5%, 17.2% and 16.5% respectively higher from US Election Day in early November.
From our politically agnostic perspective as market strategists, we’d say the glass looks better than half full when it comes to stocks’ performance rather than half empty or worse.
While we expect investors will prudently continue to look for catalysts that might cause the stock market to “get a trim” or “take a haircut,” the market might well continue in a two steps forward, one step back, rotation and rebalancing mode until a clear catalyst appears for its next decisive move.
With the current earnings season in progress and results thus far broadly better than expected and given the possibility for further improvements in the US and global economies, investors wanting to take profits now may pause to ponder fearing they might miss a next leg higher.
Our 2017 target for the S&P 500 index, which we initiated in December of last year, stands at 2,450. That’s just 2.8% above where the market closed last Friday.
Improvements in the economy, corporate earnings along with at least some progress in Washington that could result in an agreement to provide some fiscal stimulus via tax reform and infrastructure spending could take the market above our target price.
For the complete report, please contact your Oppenheimer Financial Advisor.
Other Disclosures
This report is issued and approved by Oppenheimer & Co. Inc., a member of all Principal Exchanges, and SIPC. This report is distributed by Oppenheimer & Co. Inc., for informational purposes only, to its institutional and retail investor clients. This report does not constitute an offer or solicitation to buy or sell any securities discussed herein in any jurisdiction where such offer or solicitation would be prohibited. The securities mentioned in this report may not be suitable for all types of investors. This report does not take into account the investment objectives, financial situation or specific needs of any particular client of Oppenheimer & Co. Inc. Recipients should consider this report as only a single factor in making an investment decision and should not rely solely on investment recommendations contained herein, if any, as a substitution for the exercise of independent judgment of the merits and risks of investments. The strategist writing this report is not a person or company with actual, implied or apparent authority to act on behalf of any issuer mentioned in the report. Before making an investment decision with respect to any security discussed in this report, the recipient should consider whether such investment is appropriate given the recipient's particular investment needs, objectives and financial circumstances. We recommend that investors independently evaluate particular investments and strategies, and encourage investors to seek the advice of a financial advisor. Oppenheimer & Co. Inc. will not treat non-client recipients as its clients solely by virtue of their receiving this report. Past performance is not a guarantee of future results, and no representation or warranty, express or implied, is made regarding future performance of any security mentioned in this report. The price of the securities mentioned in this report and the income they produce may fluctuate and/or be adversely affected by exchange rates, and investors may realize losses on investments in such securities, including the loss of investment principal.
Oppenheimer & Co. Inc. accepts no liability for any loss arising from the use of information contained in this report. All information, opinions and statistical data contained in this report were obtained or derived from public sources believed to be reliable, but Oppenheimer & Co. Inc. does not represent that any such information, opinion or statistical data is accurate or complete and they should not be relied upon as such. All estimates and opinions expressed herein constitute judgments as of the date of this report and are subject to change without notice. Nothing in this report constitutes legal, accounting or tax advice. Since the levels and bases of taxation can change, any reference in this report to the impact of taxation
INVESTMENT STRATEGY
should not be construed as offering tax advice on the tax consequences of investments. As with any investment having potential tax implications, clients should consult with their own independent tax adviser.
This report may provide addresses of, or contain hyperlinks to, Internet web sites. Oppenheimer & Co. Inc. has not reviewed the linked Internet web site of any third party and takes no responsibility for the contents thereof. Each such address or hyperlink is provided solely for the recipient's convenience and information, and the content of linked third party web sites is not in any way incorporated into this document. Recipients who choose to access such third-party web sites or follow such hyperlinks do so at their own risk. The S&P 500 Index is an unmanaged value-weighted index of 500 common stocks that is generally considered representative of the U.S. stock market. The S&P 500 index figures do not reflect any fees, expenses or taxes. This research is distributed in the UK and elsewhere throughout Europe, as third party research by Oppenheimer Europe Ltd, which is authorized and regulated by the Financial Conduct Authority (FCA). This research is for information purposes only and is not to be construed as a solicitation or an offer to purchase or sell investments or related financial instruments. This report is for distribution only to persons who are eligible counterparties or professional clients and is exempt from the general restrictions in section 21 of the Financial Services and Markets Act 2000 on the communication of invitations or inducements to engage in investment activity on the grounds that it is being distributed in the UK only to persons of a kind described in Article 19(5) (Investment Professionals) and 49(2) High Net Worth companies, unincorporated associations etc.) of the Financial Services and Markets Act 2000 (Financial Promotion) Order 2005 (as amended). It is not intended to be distributed or passed on, directly or indirectly, to any other class of persons. In particular, this material is not for distribution to, and should not be relied upon by, retail clients, as defined under the rules of the FCA. Neither the FCA’s protection rules nor compensation scheme may be applied. This report or any portion hereof may not be reprinted, sold, or redistributed without the written consent of Oppenheimer & Co. Inc. Copyright © Oppenheimer & Co. Inc. 2015.
