Everyday, Everyday I Have the Blues
By John Stoltzfus,
Chief Investment Strategist
By the end of February the S&P 500 had managed to shake off a large part of a down draft tied to turbulence that had emanated from the currency and commodity markets and taken stocks down 10.51% from the start of the year.
From a bottom arrived at on February 11th the broad market rallied 5.64% through the end of the month cutting its losses from the start of the year by a little more than half.
Stocks got their lift from improving economic fundamentals, some recovery in commodity prices and a better than expected—if not great—4Q earnings season.
In aggregate the positives that surfaced overwhelmed negative sentiment and put short sellers jumping for cover.
Aiding and abetting the economic data was a brace of insider buying that got noted by the financial press as well as some good old fashioned “bargain hunting” by investors searching for “babies thrown out with the bathwater” in the latest bear phase to challenge the third longest bull market in U.S. history as it climbs the proverbial Wall of Worry.
By the session close on March 9th (the anniversary of the Bull Market that began on March 9th, 2009), the S&P had rallied 8.8% from the February 11thlow with the benchmark down just 2.7% from the start of the year.
Progress not perfection is what we’ll call it for now and accept it gladly.
From a perspective of valuation, defensive sectors (particularly consumer staples and utilities) are looking richly valued while cyclical sectors (aside from energy) look attractive to us – particularly those with dividends comparable to those of their defensive counterparts. (See our sector valuation quilts on pages 26 and 27.)
With the first quarter now better than two-thirds complete, worries from earlier in the year of the possibility of a stateside recession (a concern that had carried over from the end of last quarter into the New Year) appear to have subsided considerably, overwhelmed in large part by improved conditions evidenced in stateside economic and related data.
In our view, the stateside data stream signals that domestic demand in the U.S. is helping to offset weak demand from abroad and enabling the industrial and materials space—and even the energy sector—to show levels of resilience.
Even as stocks have moved higher on improved economic data, US bond prices have remained relatively strong, keeping a lid on Treasury yields.
Foreign investors, feeling frustration with lower and even negative yields in their home markets, have sought out higher yields in stateside fixed income securities, particularly Treasuries.
From the start of the year the 10-year Treasury’s yield has trended lower, going from 2.27% on January 1 to as low as 1.66% on February 11th with the yield on the note at the end of February at 1.74% and as we prepare to go to press on March 9th it closed the day at 1.88%.
Meanwhile the dollar has begun to see its pronounced strength from the last two years begin to moderate as commodity prices have appeared to stabilize as expectations grow for the Fed to continue the process of rate normalization. As of the end of February, the dollar had respectively moved lower against six developed (G-10) and eight emerging currencies on a year to date basis. As of March 9th the dollar was lower respectively against 7 (G-10) developed and 11 emerging market currencies.
So far in 2016 the bond market stateside appears to be doing for the Fed what it either can’t or won’t do for itself as yields on Treasuries from the 2-year through the 10-year first trended broadly lower, providing a market driven slight easing of monetary conditions stateside while investors wrestled with recession fears.
From the equity rally from the bottom on February 11th , yields on the 10-year Treasury have trended higher from a low of 1.66% on February 11th to 1.74% on the last day of February, and closing at 1.88% on March 9th.
Two year U.S. Treasury yields have travelled a parallel path to the 10 year Treasuries in the same period of time.
As 4Q earnings season drew to a close, investors appeared relieved that results had not fared worse than expected by consensus analyst opinion but had come in once again somewhat better-than-expected.
The Energy sector as expected proved an unparalleled drag on the underlying benchmark’s earnings results with earnings in the Energy sector falling near 73% and reflecting in no small part the greater than 65% drop in the price of oil since mid June of 2014.
With 99% of the S&P 500’s members having thus far reported earnings, 69% reported earnings above the mean estimate while 47% of those having reported shown sales above the mean estimate, according to FactSetdata.
Ahead of 1Q 2016, analysts slashed their bottom-up earnings forecast for the S&P 500 from expectations at the end of December of a 0.3% rise to an 8.0% decline with the Energy sector and to a lesser extent the Materials sector weighing heavily on results.
We expect that in the first quarter earnings season that lies ahead that once again actual results will manage to positively offset analysts’ dour expectations for the earnings season to add support to the case for equities.
Ultimately it will be improved earnings and revenue growth that can deliver multiple expansion and higher stock prices.
We look for economic data to remain constructive and supportive of the equity market providing investors reason to cause stocks to climb the proverbial wall of worry, and sending domestic stock indexes intermittently higher, as has repeatedly happened since March of 2009.
A landscape rich but at the same time rife with transitions and transitional uncertainties will likely continue to demand patience of investors who should know what they own, why they own it and have an idea how it likely will perform as markets navigate the global landscape and the changes driven by technology, globalization, and demographics—among other key factors.
Stay tuned.
For the complete report, please contact your Oppenheimer Financial Advisor.
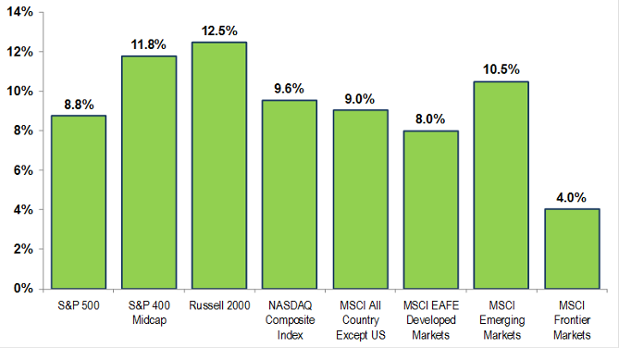
Source: Oppenheimer Asset Management Research and Bloomberg LP. Price returns are shown from 2/11/2016 through 3/9/2015.
Return calculations exclude applicable costs.
Markets worldwide saw extensive selling pressure early in 2016 that sent the S&P 500 stock index down 10.5% through February 11th.
Since the S&P 500’s closing low on February 11th, stocks began to recover. Through March 9, 2016 as we prepared to go to press, the broad index recovered 8.8%, with mid- and small-cap stocks rebounding higher.
International stocks, too, rallied in the period as well.
